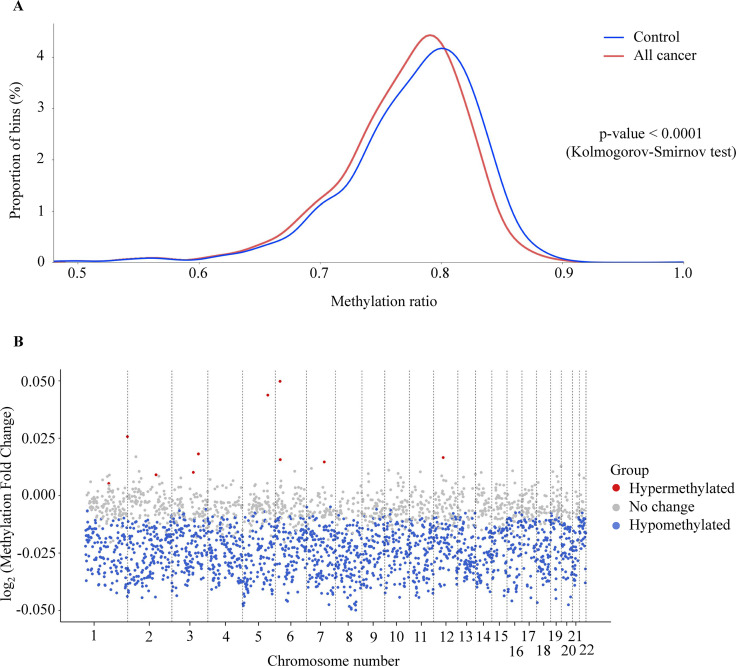
Figure 3. Genome-wide methylation changes in cell-free DNA (cfDNA) of cancer patients.
(A) Density plot showing the distribution of genome-wide methylation ratio for all cancer patients (red curve, n=499) and healthy participants (blue curve, n=1076). The left-ward shift in cancer samples indicates global hypomethylation in the cancer genome (p<0.0001, two-sample Kolmogorov-Smirnov test). (B) Log2 fold change of methylation ratio between cancer patients and healthy participants in each bin across 22 chromosomes. Each dot indicates a bin, identified as hypermethylated (red), hypomethylated (blue), or no significant change in methylation (gray).

