. 2023 Oct 11;12:RP89083. doi: 10.7554/eLife.89083

Figure 7. Model construction and performance validation for SPOT-MAS (screening for the presence of tumor by methylation and size).

(A) Two-model construction strategies for cancer detection. (B, C) Receiver operating characteristic (ROC) curves comparing the performance of single-feature models, and two combination models (concatenate and ensemble stacking) in the discovery (B) and validation cohorts (C). (D, E) Bar charts showing the specificity and sensitivity of single-feature models and two combination models (concatenate and ensemble stacking) in the discovery (D) and validation cohorts (E). (F, G) Dot plots showing the sensitivity of SPOT-MAS assay in detection of five different cancer types in the discovery (F) and validation cohorts (G). The points and error bars represent the sensitivity and 95% confidence intervals. Feature abbreviations as follows: TM – target methylation density, GWM – genome-wide methylation density, CNA – copy number aberration, EM – 4-mer end motif, FLEN – fragment length distribution, LONG – long fragment count, SHORT – short fragment count, TOTAL – all fragment count, RATIO – ratio of short/long fragment.

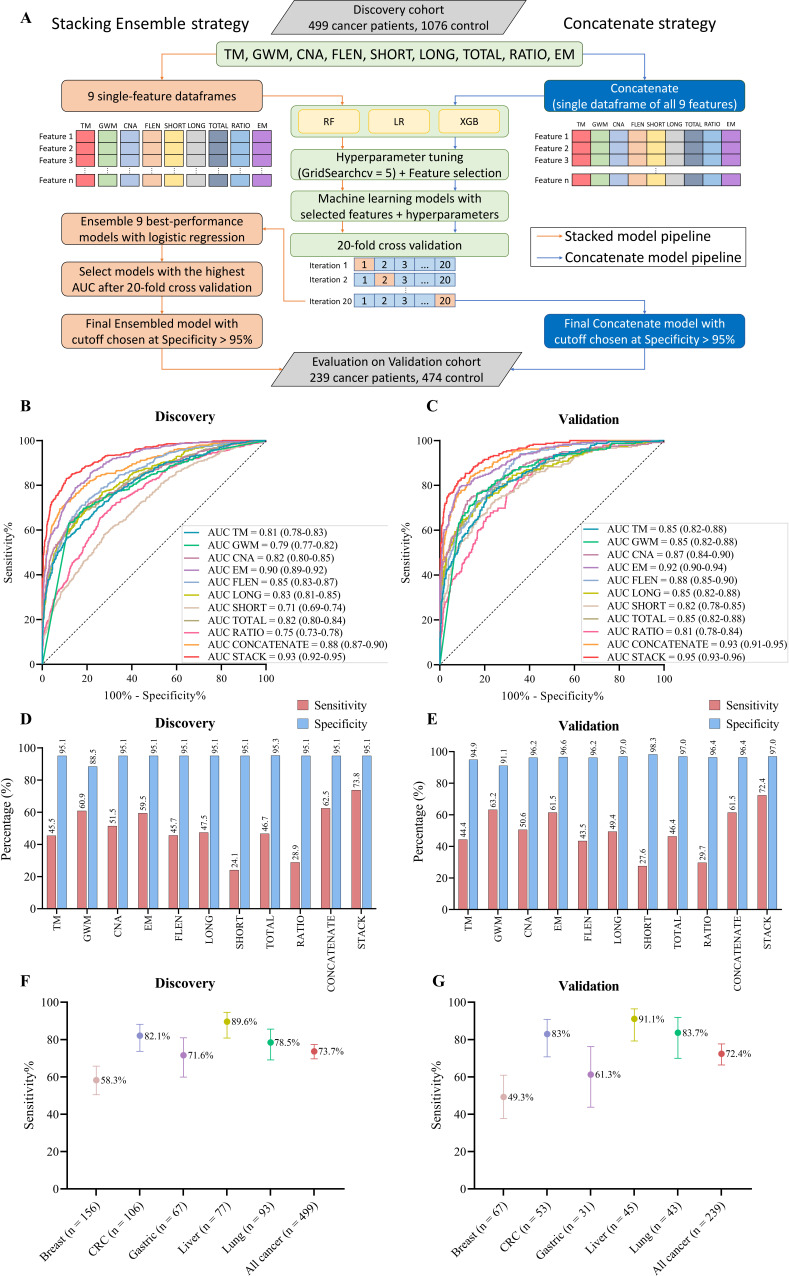
Figure 7.

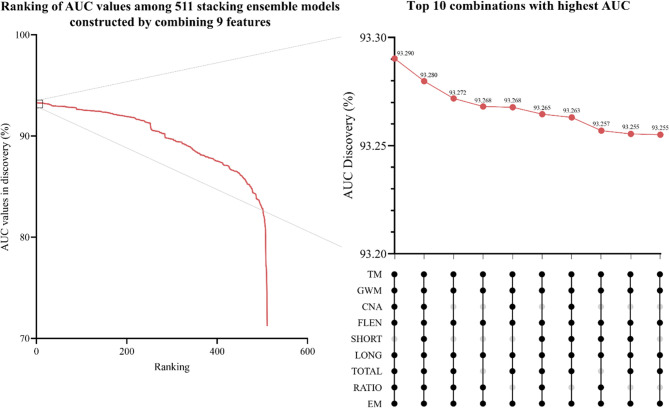
Figure 7—figure supplement 1. Exhaustive search for the optimal stacking ensemble model.

Figure 7—figure supplement 1.

The red line indicates the area under the curve (AUC) ranking of 511 ensemble combinations. The inset shows the top 10 combinations with the highest AUC value.
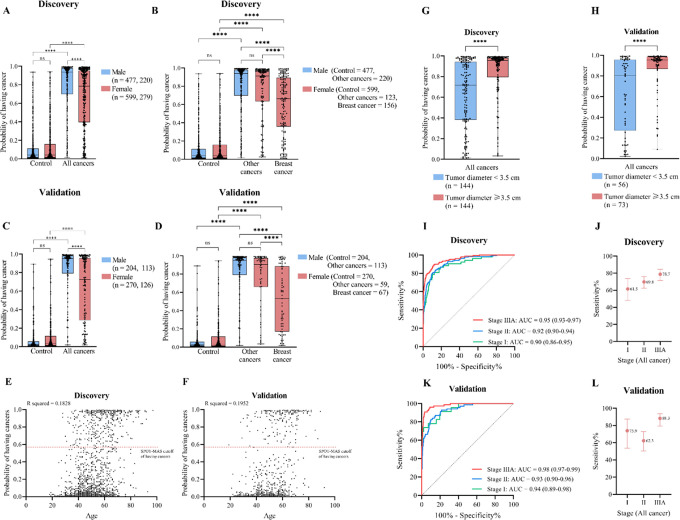
Figure 7—figure supplement 2. The effects of age, gender, tumor diameter, and cancer stages on model performance.

Figure 7—figure supplement 2.

(A, C) Box plots show probability scores of having cancer for male and female participants in the discovery (A) and validation cohort (C). (B, D) Box plots show probability scores of having cancer for male and female participants when breast cancer samples are separated from the other four cancer types in the discovery (B) and validation cohort (D). (E, F) Pearson’s correlation analysis shows no correlation between age and model prediction scores. (G, H) Box plots show prediction scores of patients with tumor diameter <3.5 cm versus those with tumor diameter >3.5 cm in the discovery (G) and validation cohort (H). (I, K) Receiver operating characteristic (ROC) curves show the classification performance of the stacking ensemble model on cancer patients with different stages (I, II, and IIIA) in the discovery (I) and validation cohort (K). (J, L) Dot plots show the sensitivity and 95% confidence intervals of SPOT-MAS (screening for the presence of tumor by DNA methylation and size) assay in the detection of stage I, II, and IIIA cancer in the discovery (J) and validation cohort (L). (A–D, G–H) Boxes correspond to interquartile ranges (IQR) which include values between 25th to 75th percentile. The horizontal line inside the box indicated the median. The whiskers extended to the smallest or largest data points. The one-tailed Mann-Whitney U test was used to compare the prediction scores among different groups. ns: not significant; ****, p<0.0001.