
Figure 8. The performance of SPOT-MAS (screening for the presence of tumor by methylation and size) assay in prediction of the tissue of origin.
(A) Model construction strategy to predict tissue of origin by combining nine sets of cell-free DNA (cfDNA) features using graph convolutional neural networks. (B) Heatmap shows feature important scores of five cancer types. (C) Bar chart indicates the contribution of important features for classifying five different cancers. (D) Three dimensions graph represents the classification of five cancer types. (E, F) Cross-tables show agreement between the prediction (x-axis) and the reference (y-axis) to predict tissue of origin in the discovery cohort (E) and validation cohort (F).

Figure 8—figure supplement 1. Construction of machine learning models for tissue of origin (TOO) identification.
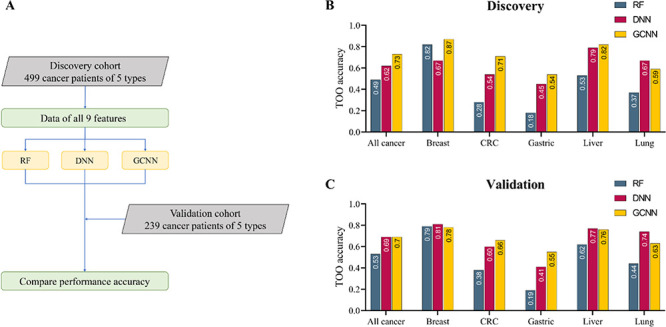
(A) Model construction strategy. Random forest (RF), convolutional neural network (CNN), and graph convolutional neural network (GCNN) are used to classify the five cancer types from the input of concatenated nine sets of cell-free DNA (cfDNA) features. The performance of constructed models was evaluated on the validation cohort. (B, C) Bar charts comparing the performance accuracy of the three models in the discovery (B) and validation cohort (C).
Figure 8—figure supplement 2. Comparison of accuracy for detecting five cancer types between single-feature model and stack model.
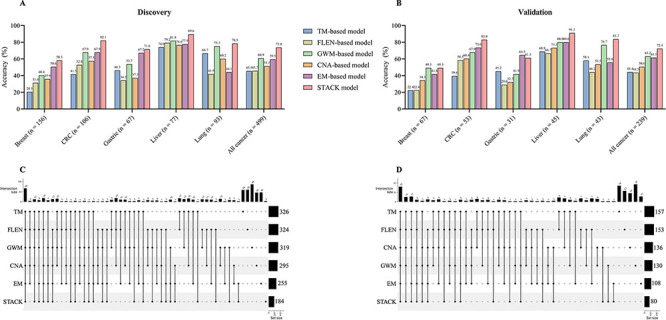
(A, B) The accuracy of single-feature models and stack model for detecting five cancer types in the discovery (A) and validation cohort (B). (C, D) The number of missed cases by the single-feature models and stack model in the discovery (C) and validation cohort (D).