Figure 5.

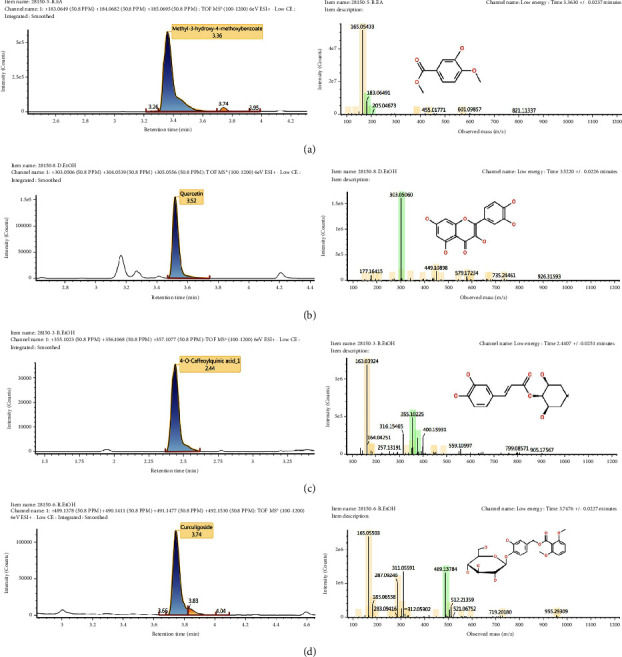
Phenolic compound chromatograms and mass spectrum of the ethyl acetate root extract (a), ethanol leaf extract (b), ethanol stem extract (c), and ethanol root extract (d).

Phenolic compound chromatograms and mass spectrum of the ethyl acetate root extract (a), ethanol leaf extract (b), ethanol stem extract (c), and ethanol root extract (d).