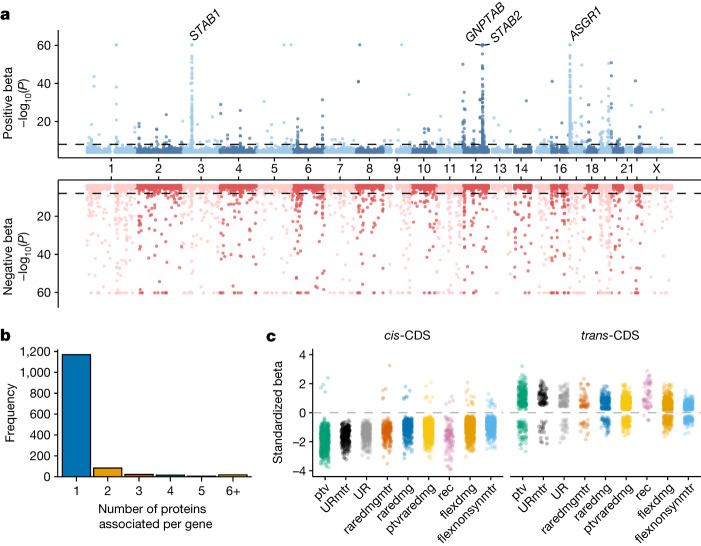
Fig. 2. Gene-level collapsing analysis.
a, Miami plot of 1,962 unique gene–protein abundance associations across nine collapsing models. We excluded the empirical null synonymous model. The y axis is capped at 60. If the same gene–protein association was detected in multiple QV models, we retained the association with the smallest P value. The four labelled loci indicate trans-CDS pQTL hotspots. P values were generated via linear regression and were not corrected for multiple testing; the study-wide significance threshold is P ≤ 1 × 10⁻⁸. b, The number of unique significant (P ≤ 1 × 10⁻⁸) protein abundance associations per gene across the collapsing models. c, The effect sizes of significant gene–protein associations in each collapsing model are stratified by cis versus trans effects.

