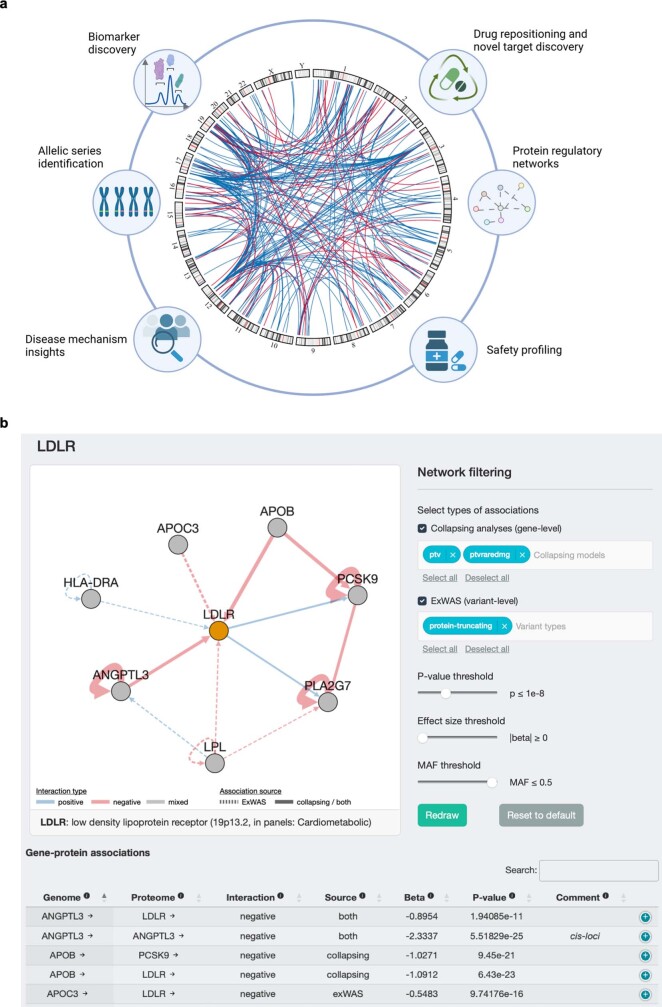
Extended Data Fig. 5. pQTL atlas and interactive browser.
(a) Illustration of potential applications of this trans-CDS pQTL atlas to drug development. The chord diagram represents trans-CDS pQTLs detected in the collapsing analysis (p ≤ 1 × 10⁻⁸). Created using biorender.com (b) The AstraZeneca pQTL browser, highlighting LDLR as an example query. Users can browse pQTLs from both the ExWAS and gene-based collapsing analyses using an intuitive range of parameters and thresholds.

