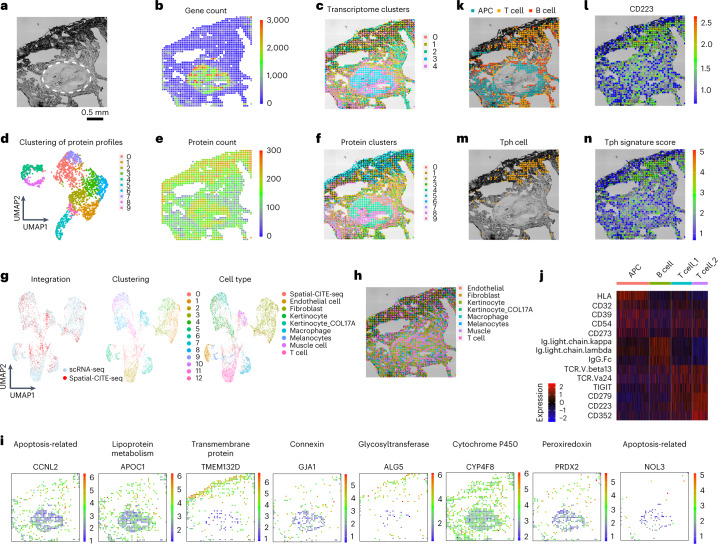
Fig. 2. Integrated spatial and single-cell profiling of a human skin biopsy tissue at the site of COVID-19 mRNA vaccination injection revealed localized peripheral T cell activation.
a, Bright-field image of skin section in the mapped region. A pilosebaceous unit is indicated by the dashed region. b, Gene count spatial map. c, Spatial clustering of all pixels based on whole transcriptome. Despite low gene count in the low cell density regions of dermal collagen, the clustering analysis revealed spatially distinct zones based on transcriptomic profiles. d, UMAP clustering of all 273 proteins. e, Protein count distribution. f, Spatial clustering of all pixels based on 273 proteins only, which is in high concordance with spatial clusters identified by spatial transcriptome co-mapped on the same tissue section. g, Integrated analysis of single-cell and spatial transcriptome. Left: The transcriptomes of spatial tissue pixels (red) conform to the clusters identified by joint analysis with scRNA-seq (blue). Middle: unsupervised clustering of the combined transcriptome dataset. Right: cell type annotation. i, Visualization of select genes associated with different gene oncology functions via integrated analysis and transfer learning. j, Differential protein expression in different cell types (APC, B cell and two subtypes of T cells). k, Spatial distribution of APCs, T cells and B cells. l, Expression of CD223 (LAG3) protein, a functional marker of activated T cells and other immune cell subsets. m, Identification of a highly localized population of Tph cells at the vaccine injection site. n, Spatial distribution of Tph gene score correlates with the cell localization. Pixel size: 25 µm.

