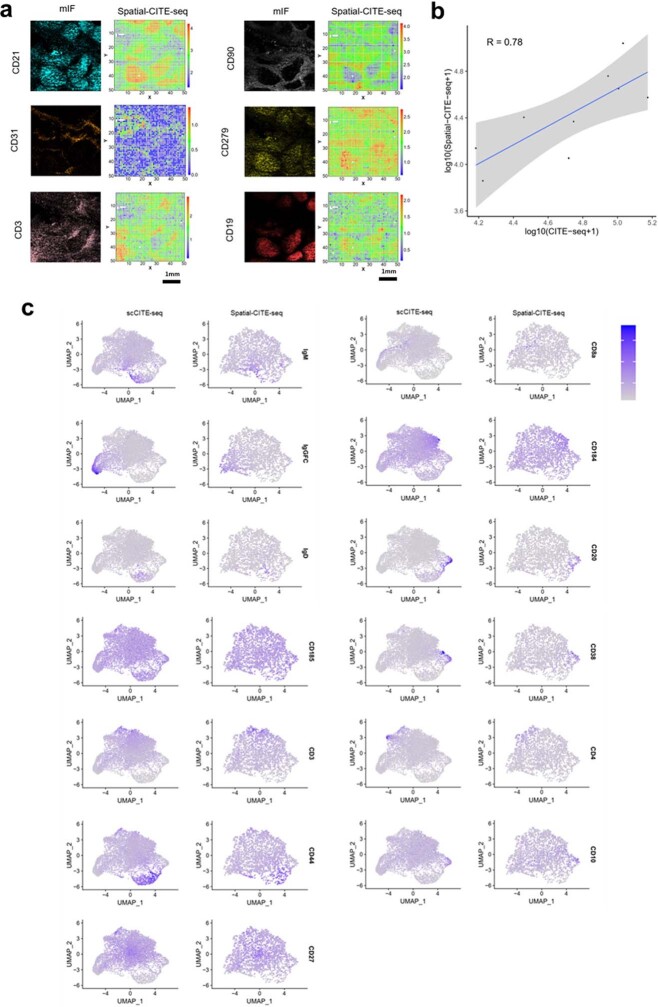
Extended Data Fig. 4. Comparison with single cell CITE-seq and immunofluorescence imaging (mIF).
(a) Multiplex immunofluorescence imaging of 6 select proteins of an adjacent tissue section (human tonsil) and comparison with the protein expression map from spatial-CITE-seq. Color key: protein expression from high to low. The image was taken without repeats. (b) Person correlation analysis of pseudo bulk data generated from Spatial-CITE-seq and scCITE-seq data of human tonsil; The fitted linear regression line is in blue color and the 95% confidence interval was shown in gray color. (c) Integration analysis of Spatial-CITE-seq and scCITE-seq data from human tonsil.

