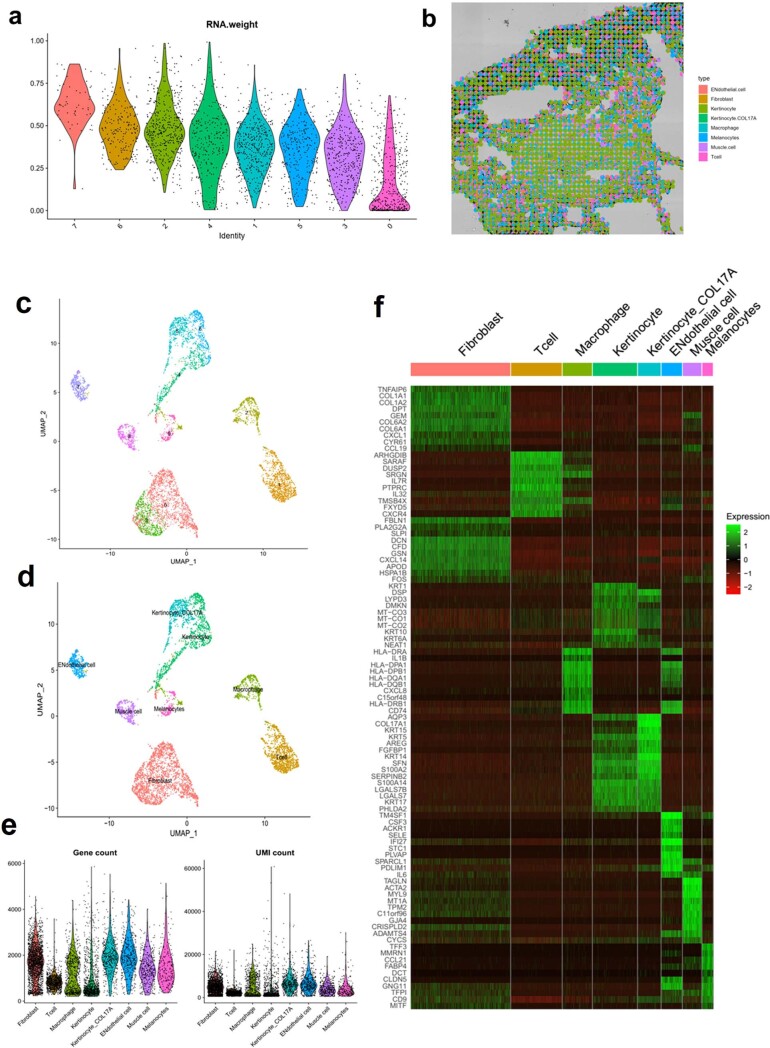
Extended Data Fig. 7. scRNA-seq sequencing data of skin biopsy sample and weighted-nearest neighbor analysis and deconvolution of Spatial CITE-seq data.
(a) The modality weights that were learned for each cluster. Most of the clusters were weighed heavily on protein. (b) The spatial Pi chart generated using Spotlight package. The single cell reference was obtained from the same skin block. (c) spatial clusters of scRNA-seq data. (d) annotated cell types using canonical marker genes. (e) violin plot of genes and UMIs for each cell type. (f) Expression heatmap of different cell types.

