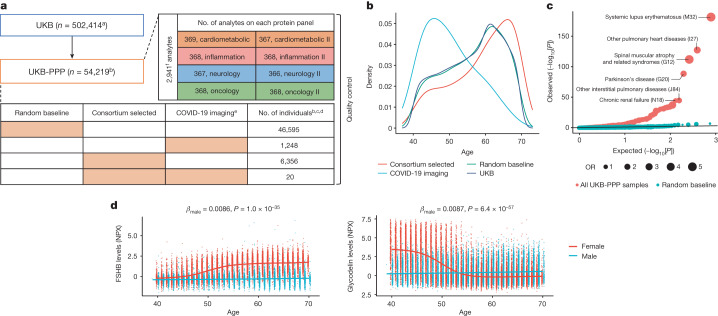
Fig. 1. Overview of UKB-PPP.
a, Sample set-up and protein measurements. The number of individuals comprising each cohort (random baseline, consortium selected, COVID-19 imaging, or a combination) is represented by the orange boxes. b, The age distribution between different subcohorts. c, Q–Q plot showing enrichment P values of the full UKB cohort compared against all of the UKB-PPP samples and UKB-PPP randomly selected baseline samples. Statistical analysis was performed using two-sided, unadjusted Fisher’s exact tests. d, Follicle-stimulating hormone beta subunit (FSHB) and glycodelin (PAEP) levels by age and sex. Linear regression coefficients and two-sided unadjusted P values for males are shown. aThe number is based on the October 2021 release of the UKB. bSamples from individuals who have withdrawn from the study are excluded except in the sample-processing schematic. cSamples (n = 13) and plates (n = 4) that were damaged/contaminated were not included in the summaries except for in the sample-processing schematic. dMultiple measurements include a combination of blind duplicate samples and bridging samples. eParticipants selected for COVID-19-positive status measured at baseline (n = 1,230), visit 2 (n = 1,209) and visit 3 (n = 1,261). Visit 2 and 3 measurements were performed together in batch 7. f2,923 unique proteins; 6 proteins were measured across 4 protein panels. NT-proBNP and BNP, IL-12A and IL-12 are treated as separate proteins. NPX, normalized protein expression.

