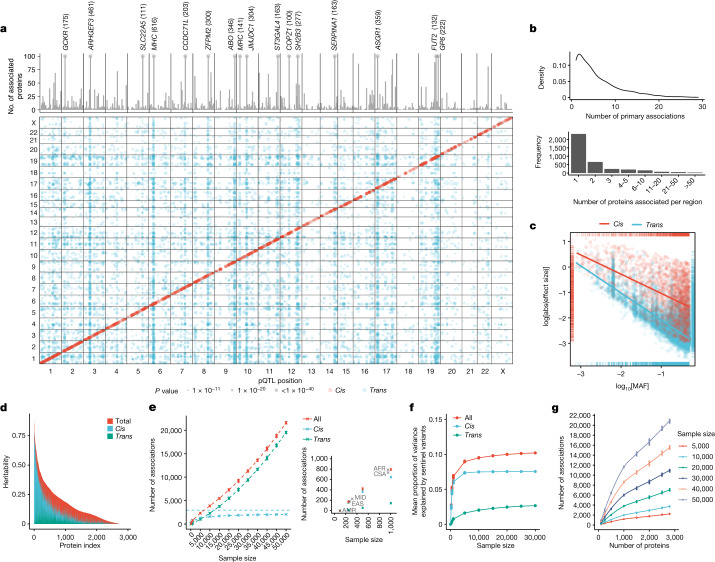
Fig. 2. The genetic architecture of pQTLs.
a, Summary of pQTLs across the genome. Bottom, genomic locations of pQTLs against the locations of the gene encoding the protein target. Red, cis pQTLs; blue, trans pQTLs. Top, the number of associated protein targets for each genomic region (the axis is capped at 100; regions with >100 number of associated proteins are labelled, with the number in parenthesis). b, The number of primary pQTLs per protein (top) and the number of associated proteins per genomic region (bottom). c, The log absolute effect size against log[MAF] by cis and trans associations. The lines indicate the linear regression slope for cis (red) and trans (blue) associations. d, The distribution of heritability and contributions from primary cis and trans pQTLs. e, The number of primary associations against sample size. Data are mean ± 3 s.d. of n = 10 independent sets of random subsamples at each sample size strata. f, The mean proportion of variance explained by primary pQTLs against sample size. g, The number of primary associations against the number of proteins assayed.

