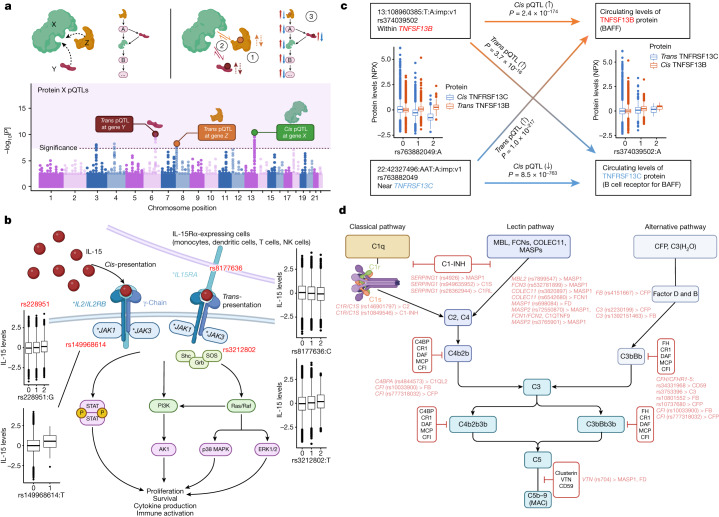
Fig. 3. Examples of pathway networks highlighted by trans pQTLs.
a, Schematic of how trans pQTLs function as part of the same protein–protein interaction or pathway as the protein tested (protein X). Top left, proteins involved may be directly interacting or indirectly involved as part of the same pathway. Bottom, trans pQTLs found for corresponding genes in trans (in addition to potentially other signals and cis associations regulating protein X). Top right, some of the mechanisms by which the trans pQTLs may regulate the target protein (protein X), including: (1) regulating the levels of the binding partners (Y, Z), which in turn affects protein X levels; (2) altering the interaction between Y/Z with X; (3) modulating components of the pathway in which Y/Z may be upstream/downstream of protein X. The figure was created using BioRender, including adaptations from ‘The principle of a genome-wide association study’. b, The IL-15-signalling pathway. The asterisks indicate genes with trans pQTLs for IL-15 (the primary association SNP is shown in red). The figure was created using BioRender, including adaptations from ‘Thrombopoietin receptor signaling’. NK, natural killer. c, Example of a bidirectional trans pQTL pair. P values were derived from REGENIE regression GWAS (two-sided, unadjusted). Orange and blue solid arrows represent cis pQTLs for TNFSF13B and TNFRSF13C; gradient lines represent trans effects of TNFSF13B variants on TNFRSF13C protein levels and trans effects of TNFRSF13C variants on TNFSF13B levels. d, The complement pathway. Trans pQTLs and the associated proteins are shown in red. The figure was created using BioRender. The box plots in b and c show the median (centre line), first and third quartiles (box limits), and 1.5× the interquartile range above and below the third and first quartiles (upper and lower whiskers). n = 52,363 independent samples.

