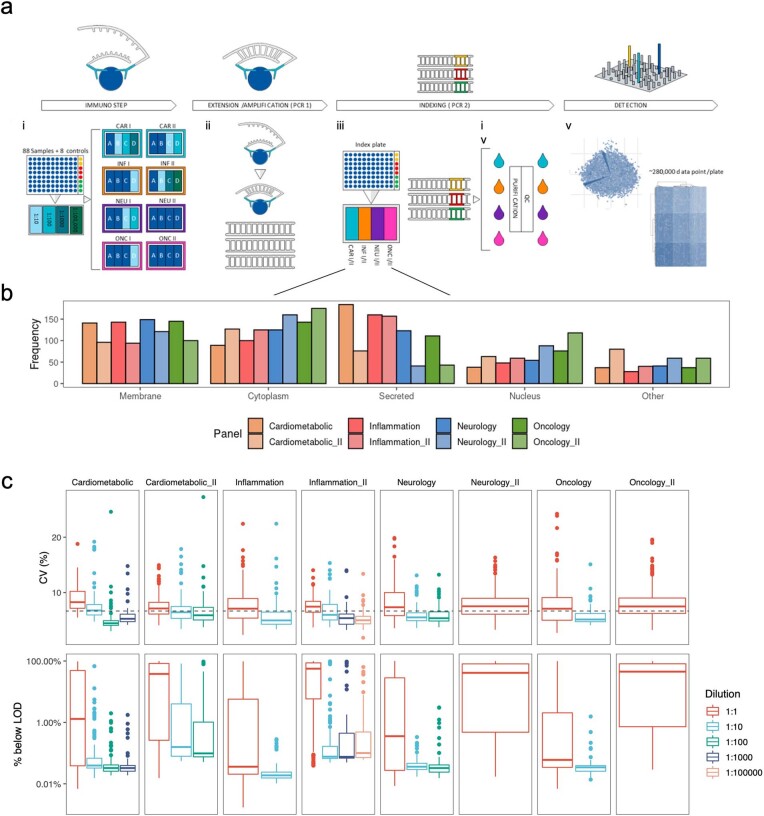
Extended Data Fig. 1. Summary of the Olink Explore proteomics assay.
(a) Summary of the Olink proteomic assay workflow. (i) Assays are run in a 96-well format, each plate consists of 88 UKB samples and 8 external control samples in column 12: sample controls (yellow) are used to determine precision within and between plates, triplicate negative controls samples (red) set the limit of detection (LOD) and triplicate plate controls (green) are used to standardize protein levels within a plate. The Explore 3072 product consists of eight 384-plex panels; Cardiometabolic (CAR) I and II, Inflammation (INF) I and II, Neurology (NEU) I and II and Oncology (ONC) I and II, and each panel consists of 4 abundance blocks, with plasma sample run 1:1 or diluted 1:1 (least expected abundance), 1:10, 1:100, 1;1000 and 1:100,000. (ii) Extension and amplification step: only matched PEA probes bind to their respective target and via PCR (PCR1) generate dsDNA amplicons, containing assay information. (iii) Indexing: all amplicons for a given sample in a single panel are pooled and unique index primers are added and are integrated into the amplicon via PCR (PCR2). (iv) All amplicons for all samples within a panel are combined to generate four sequencing libraries; the libraries are purified and quality controlled before (v) detection and being sequenced on an Illumina Novaseq 6000 instrument generating ~280,000 data points per sample plate (b) Cell compartment distribution of measured proteins by protein panel. (c) Boxplot of coefficients of variation (CVs) and % of samples with measurements below LOD by dilutions. Each box plot presents the median, first and third quartiles, with upper and lower whiskers representing 1.5x inter-quartile range above and below the third and first quartiles respectively; n = 2,941 independent protein analytes.

