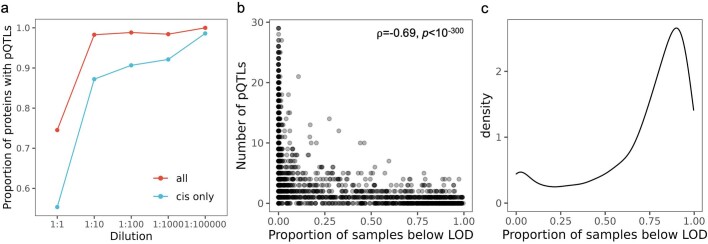
Extended Data Fig. 4.
(a) Proportion of proteins with pQTLs across different dilution sections. (b) Comparison of the number of pQTLs vs the proportion of samples with measurements below LOD for each protein. P-values (unadjusted) for Spearman’s correlation test (two-sided). (c) Density plot of the proportion of samples with measurements below LOD for proteins with no significant pQTLs (p < 1.7 × 10⁻¹¹). LOD: limit of detection. ρ: Spearman’s correlation coefficient.

