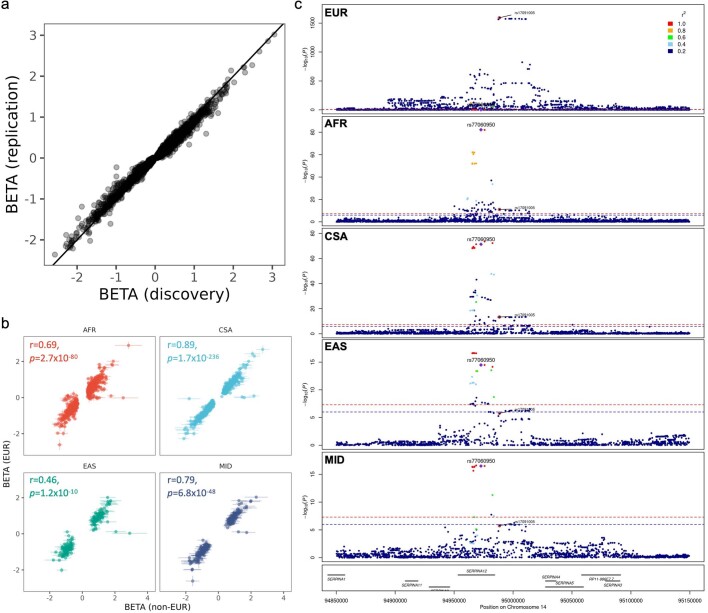
Extended Data Fig. 5.
(a) Comparison of effect sizes between discovery and replication cohorts. (b) Comparison of effect sizes between significant non-EUR ancestry specific pQTLs and EUR derived pQTLs. Error bars indicate 99% confidence intervals around the beta estimates. P-values (unadjusted) derived from Pearson’s correlation test (two-sided) on |beta| over n = 785 (AFR), 732 (CSA), 179 (EAS), 227 (MID) pQTL associations. (c) Regional association plot of the SERPINA12 cis association locus across ancestries. P-values derived from REGENIE regression GWAS (two-sided, unadjusted).

