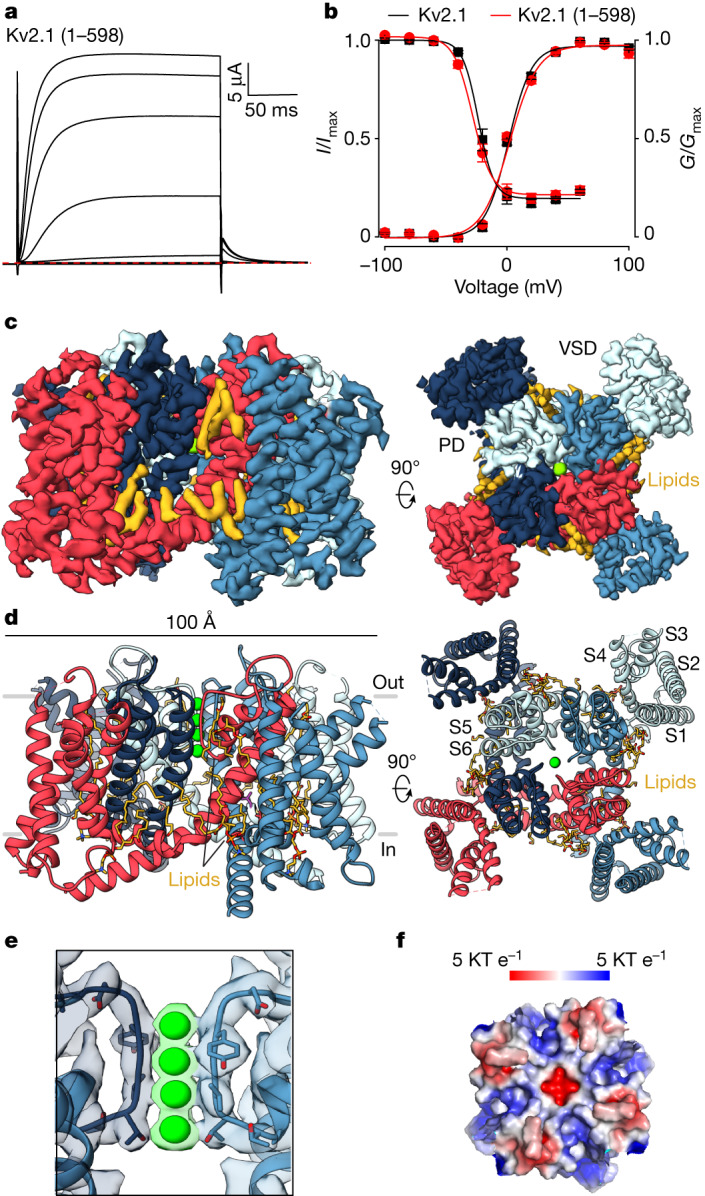
Fig. 1. Structure of the Kv2.1 channel.

a, Current traces for the structural construct of Kv2.1 (1–598) recorded in 2 mM external K+ from −100 mV to +100 mV (40 mV increments) using a holding voltage of −90 mV and a tail voltage of −50 mV. Red dotted line denotes zero current. b, Normalized conductance–voltage (G–V) relations obtained using tail currents from traces like those in a and voltage–steady-state inactivation relations curves (I–V) obtained from a three-pulse protocol (Fig. 3d) comparing the structural construct (G–V, V1/2 = 1.3 ± 1.2 mV, z =2.7 ± 0.2, n = 6 cells in two independent experiments; I–V (inactivation), V1/2 = −27.8 ± 0.9, z = 3.2 ± 0.1, n = 6 cells in two independent experiments) with the full-length Kv2.1 channel (G–V, V1/2 = 0.8 ± 1.8 mV, z = 2.8 ± 0.4, n = 10 cells in eight independent experiments; I–V (inactivation), V1/2 = −23.3 ± 1.0, z = 3.9 ± 0.3, n = 3 cells in independent experiments). Solid symbols represent mean and solid lines corresponds to fits of the Boltzmann Equations. Error bars denote the standard error of the mean (s.e.m.). c,d, Side and external views of the Kv2.1 EM map (c) and model (d), with each subunit shown in different colours. EM densities that could correspond to lipids are in yellow. e, Close-up view of the selectivity filter model superimposed with the EM map with the K+ ion densities highlighted in green. f, Top view of the electrostatic surface of the extracellular PD of Kv2.1.
