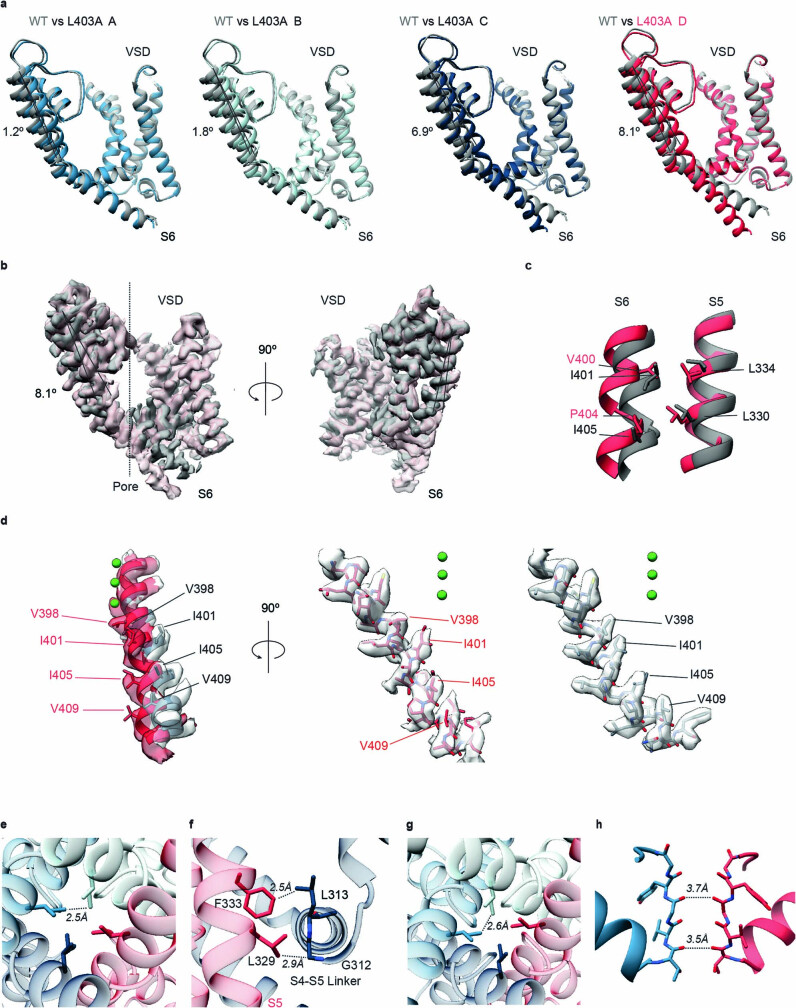
Extended Data Fig. 6. Structural comparison of Kv2.1 and the L403A mutant.
a) Superimposition of Kv2.1 (gray) with each of the four protomers of the L403A mutant aligned using the VSDs. b) Cryo-EM map of a single subunit of Kv2.1 (gray) with the map for protomer D in the L403A mutant (red). c) Conformational changes at the interface between S5 and S6 helices between Kv2.1 (gray) and protomer D of the L403A mutant (red). d) Conformational changes in the S6 helix between Kv2.1 (gray) and protomer D of the L403A mutant (red). Cryo-EM maps for S6 helices from protomer D in the L403A mutant (red) and Kv2.1 (gray) are shown to the right. e,f) A symmetrical L403A tetramer generated by aligning four D protomers to Kv2.1 based on selectivity filter. Dash lines indicate clashes between neighboring I405 side chains (e), between the sidechain of L329 and backbone of G312 (f) and between the sidechain of F333 and that of L313 (f). g,h) A symmetrical L403A tetramer modeled by aligning four D protomers to Kv2.1 based on the VSDs. Dash lines show clashes between neighboring I405 side chains (g) and distances between backbone carbonyls within the selectivity filter that are shorter when compared to those of Kv2.1 and other K+ channels whose filters are thought to be conducting (h).

