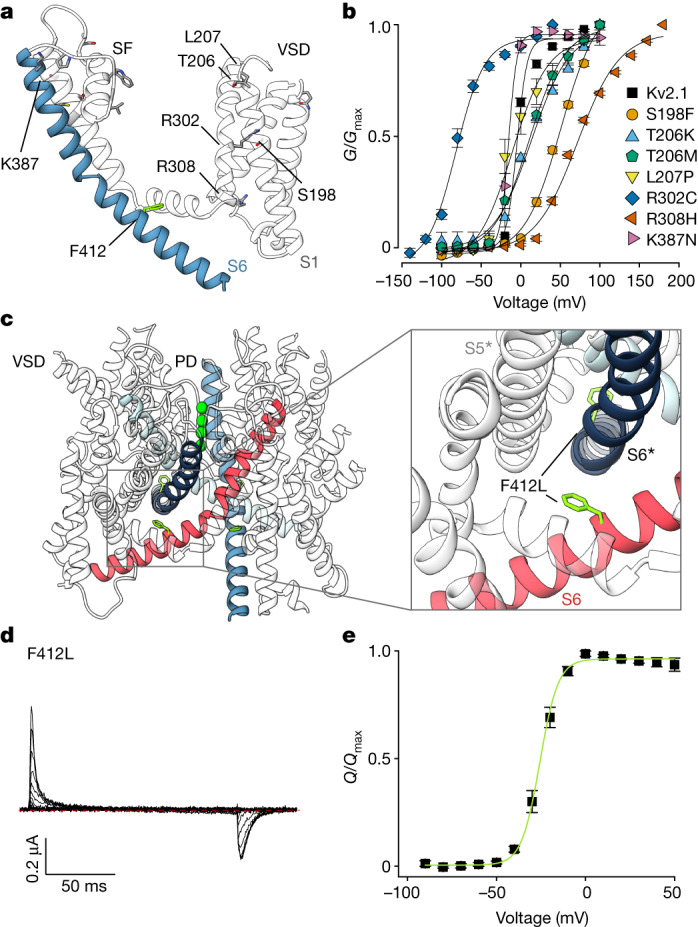
Fig. 2. Epileptic encephalopathy mutations in Kv2.1.

a, Mutations causing epileptic encephalopathy in humans mapped onto one monomer of Kv2.1, shown as a side view. b, G–V relations recorded for epileptic encephalopathy mutations highlighted in a and obtained from a family of voltage steps ranging from −150 to +200 mV in 100 mM external K+. Symbols represent mean and solid curves correspond to a fit of the Boltzmann equation. See Extended Data Fig. 2e for traces and Supplementary Table 1 for parameters of the fits and n values. c, Location of F412 in the Kv2.1 structure with adjacent S6 helices highlighted with different colours. d, Gating currents recorded for the F412L epileptic encephalopathy mutation from −90 mV to +50 mV in 2 mM external K+ (10 mV increments) from a holding voltage of −90 mV using a P/−4 protocol to subtract leak and capacitive currents. Red dotted line denotes zero current. e, Normalized Q–V relation obtained for F412L by integrating the OFF gating currents. Symbols represent mean and green solid curve corresponds to a fit of the Boltzmann Equation with V1/2 = −25.2 ± 0.4 mV, z = 4.4 ± 0.2 (n = 4 cells in two independent experiments). For all panels error bars are s.e.m.
