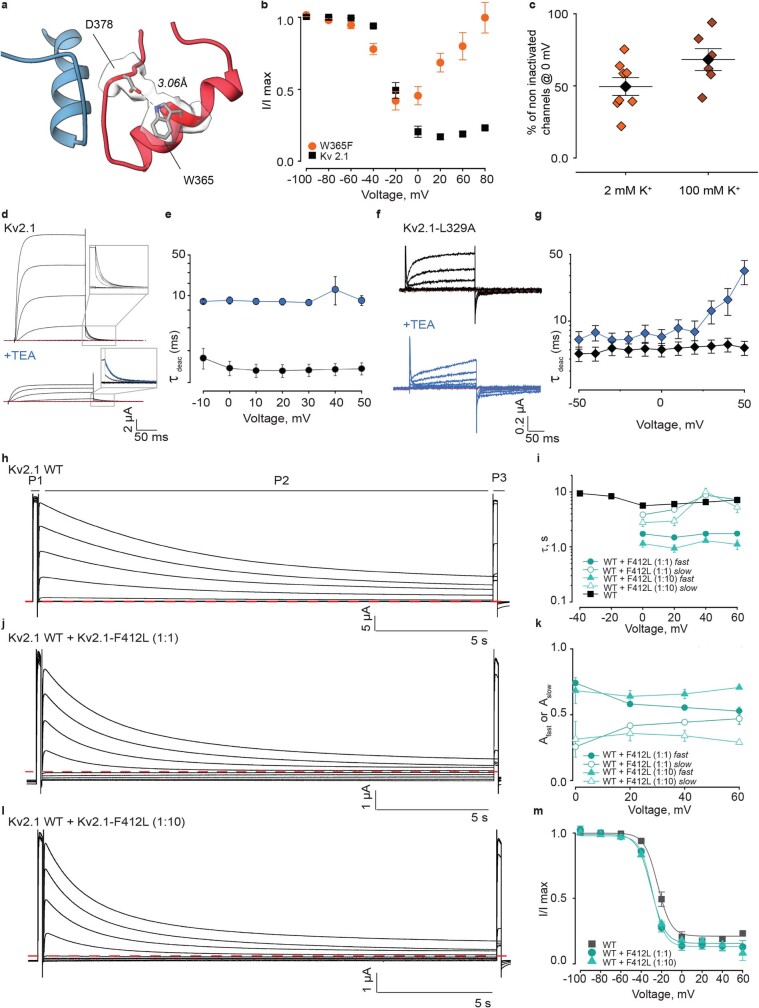
Extended Data Fig. 4. Exploring the non-conducting mechanism for Kv2.1 F412L.
a) Close up view of the model and EM map for D378 in the P-loop and W365 in the pore helix. Dashed line represents a hydrogen bond. b) Fraction of non-inactivated channels (P3/P1) in response to the P2 family of voltage steps from −100 to +60 mV for Kv2.1 (black squares; n = 3 in 2 independent experiments) and the W365F mutation (orange circles; n = 5 in 2 independent experiments). Similar protocol to that illustrated in Fig. 3d. External K+ was 2 mM. c) Fraction of non-inactivated channels for Kv2.1 W365F recorded in 2 or 100 mM external K+ using P/−4 subtraction. Coloured diamonds denote individual experiments (n = 8 cells in 2 independent experiments for 2 mM K+ and n = 6 in 2 independent experiments for 100 mM K+) and solid black diamonds represent mean. d) Family of current traces for Kv2.1 with 2 mM external K+ in the absence and presence of internal TEA. Test depolarizations were from −100 to +50 mV in 10 mV increments from a holding voltage of −90 mV using P/−4 subtraction. Insets show tail currents recorded at –50 mV. Red line indicates zero current. e) Plot of time constant of deactivation for Kv2.1 in the absence and presence of internal TEA (n = 3 in 2 independent experiments). f) Family of current traces for Kv2.1 L329A with 2 mM external K+ in the absence and presence of internal TEA. Test depolarizations were from −90 to +50 mV in 10 mV increments with holding and tail voltages of −90 mV using P/−4 subtraction. Red line indicates zero current. g) Plot of time constant of slow current measured for Kv2.1 L329A upon repolarization in the absence and presence of internal TEA (n = 7 in 4 independent experiments). h) Current families for Kv2.1 obtained using a three-pulse protocol with 2 mM external K+ and a holding voltage of −100 mV. The first pulse (P1) was to +60 mV, followed by a brief closure to −100 mV, the test pulse (P2) was from −100 to +60 mV for 20 s to allow the channels to inactivate, and a third pulse (P3) to the same voltage than P1 to assess the fraction of inactivated channels i) Plot of time constants (τ) of inactivation against P2 voltage. τ was obtained by fitting a single or double exponential function to the time course of the test current in P2. Data points are mean and error bars are S.E.M. for Kv2.1 (black squares; n = 3 in 2 independent experiments), Kv2.1+Kv2.1-F412L (1:1) (green circles; n = 3 in 2 independent experiments) and Kv2.1+Kv2.1-F412L (1:10) (green triangles; n = 4 in 2 independent experiments). j) Current families obtained as in h but when co-expressing Kv2.1 with the F412L mutant using a 1:1 molar ratio of cRNA. k) Amplitudes for the fast and slow components of the double-exponential fits obtained when co-expressing Kv2.1 with F412L. Same cells and n values as panel i. l) Current families obtained as in h but when co-expressing Kv2.1 with the F412L mutant using a 1:10 molar ratio of cRNA. m) Plot of fraction of non-inactivated channels during each P2 voltage step for Kv2.1 (black squares; n = 3 in 2 independent experiments), Kv2.1+Kv2.1-F412L (1:1) (green circles; n = 6 in 2 independent experiments) and Kv2.1+Kv2.1-F412L (1:10) (green triangles; n = 6 in 2 independent experiments) obtained by measuring the steady-state current at P3 normalized to P1. Smooth curves are fits of a Boltzmann equation (Kv2.1, V1/2 = −23.3 ± 1.0 mV, z = 3.9 ± 0.3; Kv2.1:F412L 1:1, V1/2 = −30.1 ± 1.4 mV, z = 4.1 ± 0.3; Kv2.1:F412L 1:10, V1/2 = −30.1 ± 2.1 mV, z = 3.6 ± 0.3). For all panels error bars are S.E.M.

