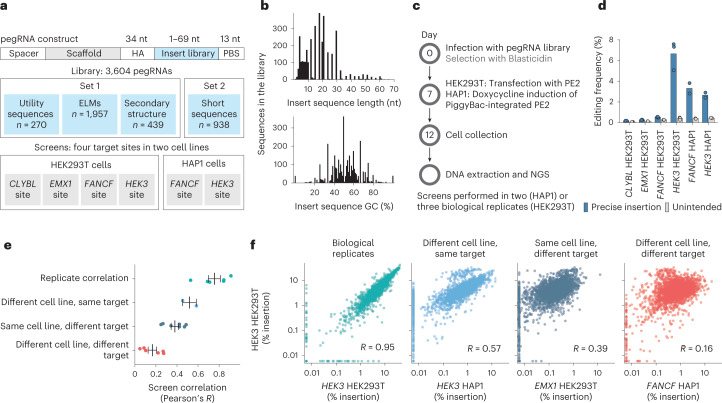
Fig. 1. High-throughput measurement of prime insertion efficiencies.
a, Screen setup. Set 1 and Set 2 libraries were screened separately and data merged (Methods); panels d–f reflect Set 1 results only. b, Library composition. The number of sequences in the library (y axis) with different insert sequence lengths (x axis, top panel) and %GC content (x axis, bottom panel). c, Experimental design. NGS, next generation sequencing. d, Editing frequencies. Average mutation frequency (y axis) for different screens (x axis) stratified by mutation type (blue, insertions; gray, unintended outcomes). Markers represent one replicate and bars the average across n = 3 biological replicates. e, Replicate concordance. Pearson’s R between insertion rates in two screens (x axis) for different comparisons (y axis, colors). Markers, correlation value of one pair of screens (for replicate correlations, mean of pairwise comparison across n = 3 biological replicates); line and whiskers, mean and s.e.m. f, Representative examples of categories from e. Percentage insertion in the HEK3 locus in HEK293T cells (y axis) compared with values (x axis) in other contexts (panels, colors) for insertion sequences (markers). Left panel, comparison of biological replicates; other panels, comparison of replicate averages. Label, R of values in linear scale. Colors as in e.

