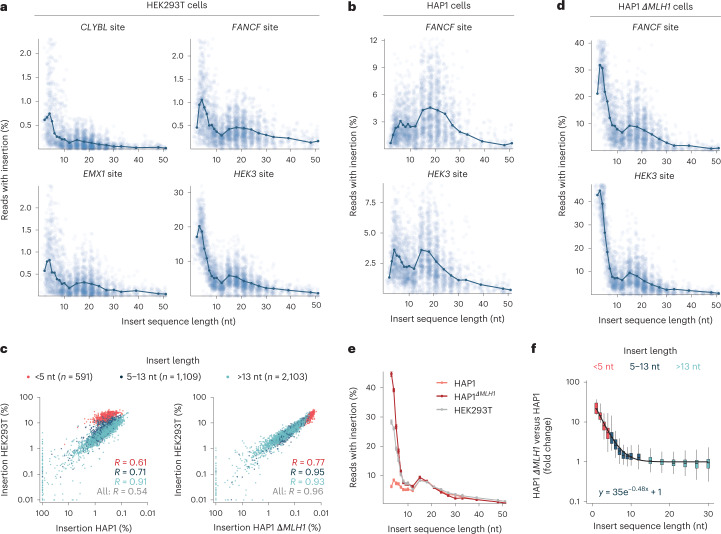
Fig. 2. Prime insertion efficiency depends on insert length and MMR.
a, Insertion rate in HEK293T cells. Percentage of reads with insertion (y axis, cut-off at 3 s.d. above mean) for different insert sizes (x axis) of individual sequences (blue markers) and averages for lengths with at least 30 measured sequences (dark blue line and markers) at different target sites (panels). Data represent the average of n = 3 biological replicates. b, As a, but for HAP1 cells. c, As a, but for HAP1 ∆MLH1 cells. d, Insertion rate in one cell context (y axis) compared with in another context (x axis) at the HEK3 target of individual sequences (markers), comparing HEK293T with HAP1 cells (left panel) and HEK293T cells with HAP1 ∆MLH1 cells (middle panel). Red, short sequences (up to 4 nt); blue, medium sequences (5–13 nt); teal, longer sequences (>13 nt). Label, R between rates. The data are an average from n = 3 biological replicates (HEK293T) or n = 2 biological replicates (HAP1). e, Average insertion rates (y axis) across insert lengths (x axis) with at least 30 measured sequences in various cell line contexts (colors). Data are presented as mean ± s.e.m. n = 3 biological replicates (HEK293T) or n = 2 biological replicates (HAP1). f, The ratio of relative insertion rates (Methods) at the HEK3 locus between HAP1 ∆MLH1 and HAP1 cells (y axis) for different lengths (x axis) stratified by colors as in d. Box, median and quartiles; whiskers, least extreme of 1.5 times the interquartile range from the quartile and most extreme values. Line, fit from an exponential model (ratio ≈ a × exp(−b × length) + 1). n = 2 biological replicates.

