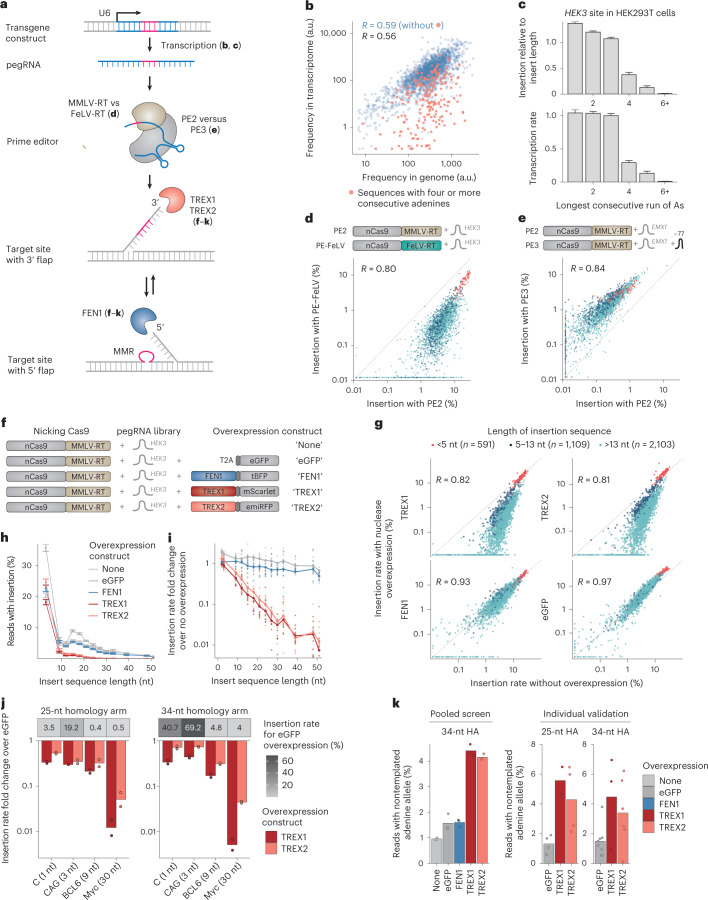
Fig. 3. Effects of prime editing steps.
a, Schematic of molecular steps involved in prime editing. b, Normalized pegRNA count derived from sequencing of PCR amplicons from genomic DNA (x axis) or PCR amplicons from RNA (y axis) for the HEK3 site in HEK293T cells for individual pegRNAs (markers). Pink, inserts with four or more consecutive adenines. Data represent the average of n = 3 biological replicates. c, Top panel, average insertion rate relative to length bin median (y axis) for inserts stratified by the longest consecutive run of adenines (x axis). Bottom panel, instead showing transcription rate (read counts from RNA/read counts from DNA) on the y axis. Data are presented as mean ± s.e.m. n = 3 biological replicates. d, Insertion frequencies at the HEK3 site in HEK293T using the standard MMLV reverse transcriptase (PE2, x axis) and the FeLV reverse transcriptase (PE-FeLV, y axis) for different insertion sequences (markers). Colors, number of neighboring points. n = 3 biological replicates. e, As d, but comparing PE3 and PE2 at the EMX1 site. f, Schematic of screens with overexpression constructs. g, Insertion frequencies for different overexpressions (y axis and panels) compared with no overexpression (x axis) for three biological replicate screens (markers) stratified by insertion sequence lengths (colors). h, Average insertion rates (y axis) across insert lengths (x axis) with at least 30 measured sequences for overexpression constructs (colors). Data are presented as mean ± s.e.m. n = 3 biological replicates. i, As h, but instead displaying the insertion rate fold changes of screens with overexpressions compared with no overexpression (y axis), calculated from the ratio of sums of all sequences (lines) or of ten randomly sampled sequences. j, Top, average insertion frequency (grayscale) of four sequences with varying lengths (x axis) when overexpressing eGFP stratified by homology arm lengths (panels). Bottom, insertion rate fold changes compared with eGFP (y axis) when overexpressing TREX1 and TREX2 (colors). n = 2 biological replicates. k, Fraction of the nontemplated adenine allele at the +9 position (y axis) for cells with overexpression constructs (x axis and colors) stratified by experiment and homology arm lengths (panels). Markers show screen averages from three biological replicates for the pooled screen or from separate pegRNAs for the individual validation experiment.

