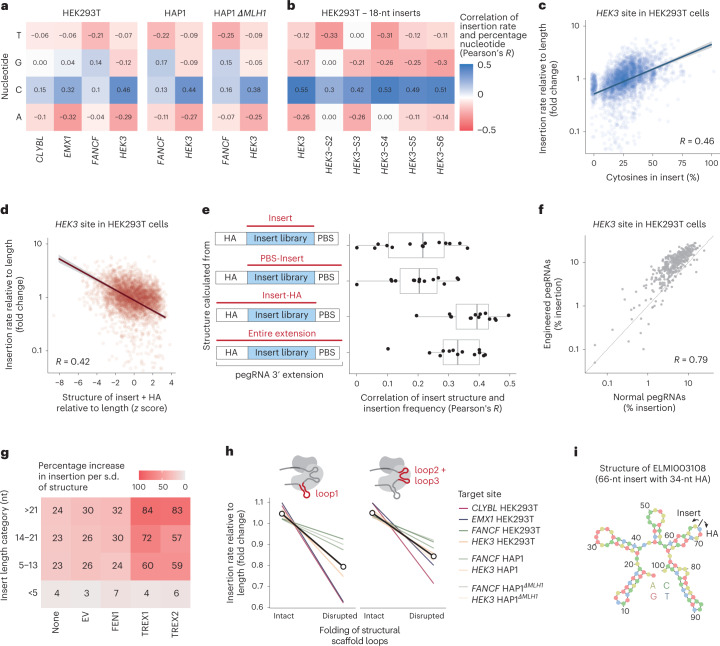
Fig. 4. Cytosine content and secondary structure of the insert sequence are positively correlated with the insertion rate.
a, Correlation of length-normalized insertion rate with nucleotide frequency in the insert (colors) for each nucleotide (y axis) in each screen (x axis). Data represent the average of n = 3 (HEK293T) or n = 2 (HAP1) biological replicates. b, As a, but for a new set of screens with 18-nt inserts and 15-nt homology arms targeting five novel sites within 1 kb of the HEK3 site. c, Insertion rate at the HEK3 site in HEK293T cells relative to length bin median (y axis) for inserts (markers) with different cytosine content (x axis). Line, linear regression fit; shaded area, 95% posterior confidence interval of the fit. Data represent the average of n = 3 biological replicates. d, Insertion rates at the HEK3 site in HEK293T cells relative to length bin median (y axis) for inserts (markers) with calculated Gibbs free energy (∆G) from ViennaFold (x axis). Line, linear regression fit; shaded area, 95% posterior confidence interval of the fit. Data represent the average of n = 3 biological replicates. e, Correlation (x axis) between insertion rates and insert sequence free energy calculated from different parts of the 3′ extension (y axis). Box, median and quartiles; whiskers, least extreme of 1.5 times the interquartile range from the quartile and most extreme values. n = 3 (HEK293T) or n = 2 (HAP1) biological replicates. f, Insertion rates for sequences (markers) at the HEK3 site in HEK293T for pegRNAs (x axis) and epegRNAs (y axis). Data represent the average of n = 3 biological replicates. g, Percentage increase in insertion rate with each standard deviation increase in structure strength (colors) for different overexpression constructs (x axis) and insertion sequence lengths (y axis). h, Insertion rates relative to length bin median (y axis) for sequences that disrupt or preserve (x axis) scaffold loops (panels). Colored lines show screen medians and the thicker black lines and dots show the median across all screens. i, The predicted secondary structure of a 66-nt insert sequence (ELMI003108) with the HEK3 homology arm.

