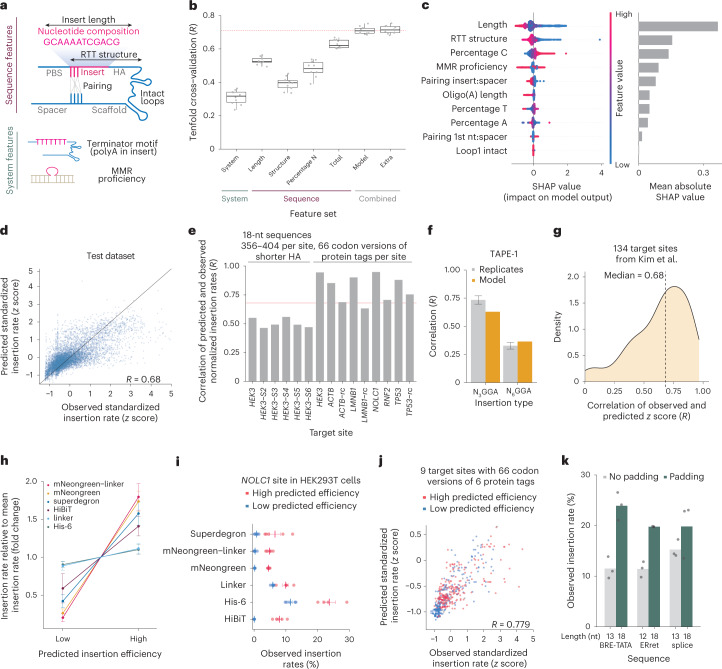
Fig. 5. Predicting prime insertion efficiencies.
a, Schematic representation of model features. b, Tenfold cross-validation model performance on the training set (y axis) using different feature sets. System: MMR proficiency and Oligo(A) length. Sequence effects: length, reverse transcriptase template (RTT) structure, nucleotide composition and all of them combined (‘Total’). Model: combination of ten features. Extra: 53 features. Dashed line, median of ‘Model’. Box, median and quartiles. Whiskers, 1.5 times interquartile range. c, Feature importance. Left, distribution of SHAP values (x axis) for each feature (y axis, colors). Right, respective mean absolute SHAP values (x axis). d, Concordance of predicted (y axis) and observed (x axis) insertion efficiencies on the held-out test set (markers). Solid line, y = x. Label, Pearson’s R. An additional 18 points are beyond the plot limits (Supplementary Fig. 12). e, Concordance of predicted and observed values at new sites. Pearson’s R between predicted and observed normalized insertion efficiencies (y axis) for 356–388 18-nt sequences inserted into six different sites within the HEK3 locus (left bars) and 66 codon variants of six protein tags into nine sites in HEK293T cells (right bars). Line, performance on the dataset from d. f, Mean replicate correlation (light gray) ±s.e.m. and concordance of predicted and observed rates (yellow) on 6- and 9-nt insertions (63 and 1,908 sequences, respectively) at the TAPE-1 target from (ref. 42). g, Distribution of Pearson’s R between observed and predicted insertion rates (x axis) of seven insertions into 134 loci from (ref. 17). Dashed line, median. h–j, Measured insertion rates of predicted high- and low-inserting codon versions of six protein tags into nine sites. h, Measurements of insertion rate relative to mean insertion rate of codon sequences (y axis, colors) separated into predicted to be highly and lowly inserting (x axis). i, Insertion rates (x axis) of codon variants (markers) of six protein tags (y axis) into the NOLC1 site in HEK293T cells. Red, large predicted rate; blue, low predicted rate. Bar and whiskers, mean ± s.e.m. j, Concordance of observed and predicted insertion rates of all sequences for all target sites and codon variants. k, Effect of padding. Insertion rates (y axis) of three sequences (x axis) inserted without modification (gray) and padded with optimally predicted sequences to 18 nt (green).

