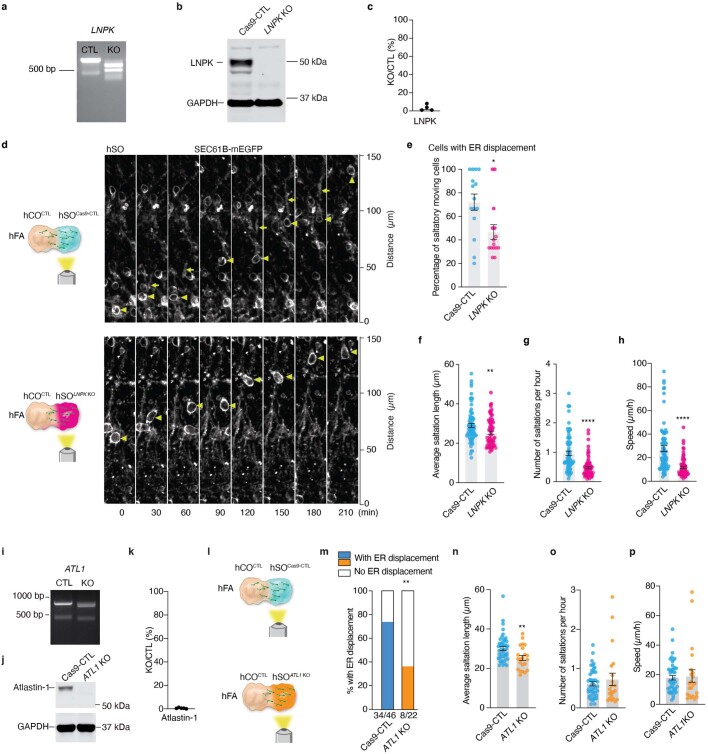
Extended Data Fig. 10. Deletion of LNPK or ATL1 impaired ER displacement and saltation length of hSO saltatory migrating cells.
A, Genotype analysis of genomic DNA extracted from hSO showing the PCR amplicon of LNPK. b, Representative western blotting image showing LNPK expression in LNPK KO and Cas9-CTL hSO derived from the SEC61B-mEGFP hiPS cells. GAPDH was used as a loading control. c, Quantification of LNPK abundance (n = 4, from 3 differentiations). d, Representative time-lapse sequences of SEC61B-mEGFP+ cells moving in a saltatory pattern in hSO assembled with an unlabeled hCO. ER displacement was detectable in the last three steps of the four in Cas9-CTL, but not in the LNPK KO. e, Percentage of SEC61B-mEGFP+ saltatory moving cells in the hSO side of the hFA showing ER displacement (hFA at 29–52 days after assembly. n = 15 hFA from one differentiation). * P = 0.0218, two-tailed Mann-Whitney test. f–h, Quantification of saltation length, number of saltations, and speed of movement of SEC61B-mEGFP+ cells in (d) (Cas9-CTL, n = 73 cells; LNPK KO, n = 68 cells). f, ** P = 0.0042, g, h **** P < 0.0001, two-tailed Mann-Whitney test. i, PCR analysis of hiPS cells showing the amplicon of ATL1. j, Representative western blotting image showing atlastin-1 abundance. GAPDH was used as a loading control. k, Quantification of atlatin-1 abundance (n = 5 from 4 differentiations). l, Schematic illustrating experimental design for performing live imaging on the hSO side of the hFA to observe saltatory migration. m, Percentage of saltatory migrating SEC61B-mEGFP+ cells showing ER displacement (Cas9-CTL, n = 46 cells from 12 hFA from 3 differentiations, 34 cells displayed ER displacement; ATL1 KO, n = 22 cells from 9 hFA from 2 differentiations, 8 cells displayed ER displacement; two-sided Chi-square test, ** P = 0.0029). n–p, Quantification of saltation length (n, ** P = 0.0067), number of saltations (o, P = 0.5891), and speed of movement (p, P = 0.2646) of SEC61B-mEGFP+ cells in (m) (Cas9-CTL, n = 46 cells, from 3 differentiations; ATL KO, n = 22 cells from 2 differentiations); two-tailed Mann-Whitney test. Data are presented as mean ± s.e.m. (c, e, f–h, k, n–p).

