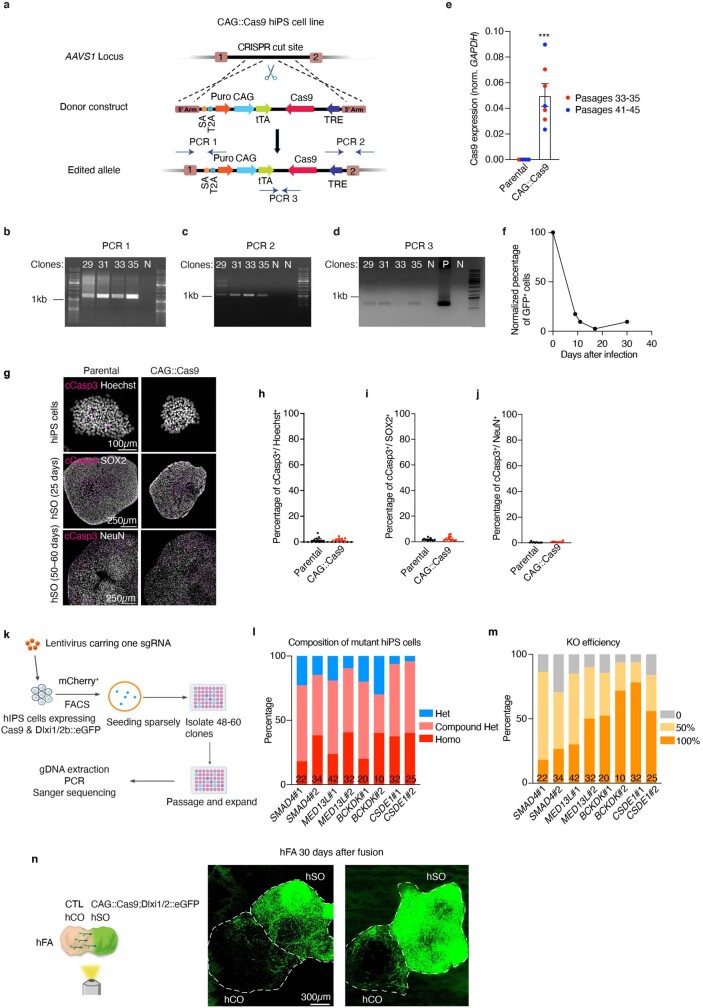
Extended Data Fig. 1. Generation and validation of the CAG::Cas9 hiPS cell line.
A, Schematic showing the strategy to generate the CAG::Cas9 hiPS cell line. Dashed lines indicate homologous recombination sites. PCR 1–3 indicate the three pairs of primers designed to confirm the insertion of the entire donor. b–d, PCR confirming the successful amplification of the targeted DNA as shown in (a). “N”: negative control (PCR product from a control hiPS cell line). “P”: positive control (PCR product from the donor plasmid). In total, 35 clones were screened, and 3 clones (Clone #29, #31, and #35) were positive in all PCR reactions. e, Cas9 expression in CAG::Cas9 hiPS cells compared to the parental cells (n = 7 independent hiPS cell samples) by real-time-qPCR. *** P = 0.0006, two-tailed Mann-Whitney test. f, Genome editing efficiency in CAG::Cas9 hiPS cells. CAG::Cas9 hiPS cells were infected with a lentivirus harbouring GFP and a sgRNA against GFP. Infected cells were split into two groups with or without doxycycline (DOX) supplementation to inhibit Cas9 expression. Cells were subjected to flow cytometry to examine the percentage of GFP+ cells. The percentage of GFP+ cells (–DOX)/percentage of GFP+ cells ( +DOX) at each time point was plotted. g, Representative immunofluorescence images of hiPS cells and hSO for the quantifications in h–j. h–j, Percentage of cCasp3+ cells of Hoechst+ hiPS cells (h, n = 9 colonies from 3 passages) and percentage of cCasp3+ cells of SOX2+ (i, n = 12 organoids from 3 differentiations) or NeuN+ (j, n = 12 organoids from 4 differentiations) cells in hSO. h, j, Two-tailed Mann-Whitney test; h, P = 0.4742; j, P = 0.063; i, P = 0.1933, two-tailed unpaired t-test. k, Schematic showing experimental design for examining the deletion state of mutations in the CAG::Cas9;Dlxi1/2b::eGFP hiPS cells following transduction with a lentivirus expressing an individual sgRNA. l, Analysis of deletion state of mutant hiPS cells transduced by lentiviruses carrying 8 distinct sgRNAs. Homo: homozygous mutation. Het: heterozygous mutation. The number at the bottom of each column indicates the number of mutant clones we acquired for each sgRNA. m, Analysis of the KO efficiency of mutations reported in (l). If one allele had an in-frame deletion/insertion of less than 21 bp, its KO efficiency was assumed to be 0. n, Representative live images of hFA at 30 days after assembly. Day 45 CAG::Cas9;Dlxi1/2b::eGFP hSO were assembled with day 60 unlabeled hCO. The dashed lines indicate the boundary of hCO and hSO. Data are presented as mean ± s.e.m. (e, h–j).

