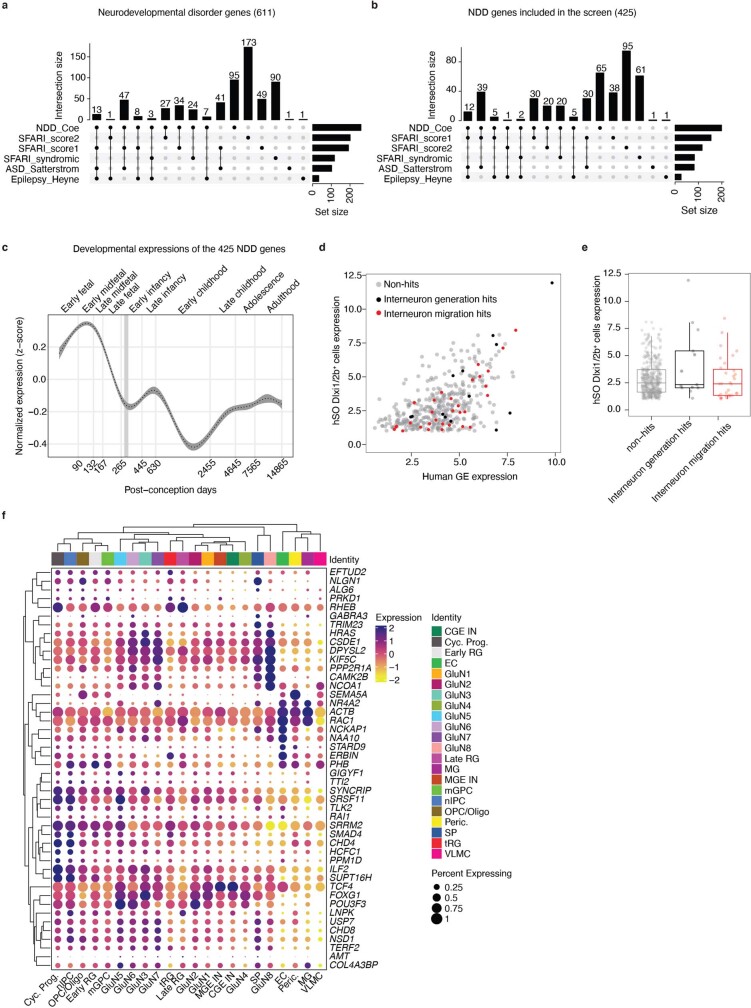
Extended Data Fig. 2. Summary of NDD genes and the genes included in the screen.
a, Sources of the 611 NDD genes. b, Sources of the 425 NDD genes included in the screens. c, Expression trajectories in the human cerebral cortex of the selected 425 NDD genes using the BrainSpan dataset60. Displayed are fitted (generalized additive model; denoted with dashed line) z-score normalized expression data with 99% confidence interval shown in grey (n = 425 genes; n = 419 cortical samples). d, e, Expression in hSO Dlxi1/2b::eGFP+ cells of screen hit genes compared with non-hit genes. e, Boxplot (horizontal line denotes median; lower and upper hinges correspond to the first and third quartiles; whiskers extend 1.5 times the interquartile range with outliers shown outside this range) representation of expression levels; non-hits (n = 392 genes) versus interneuron generation hits (n = 13 genes): P = 0.2013; non-hits versus interneuron migration hits (n = 33 genes): P = 0.404; two-sided Wilcoxon tests. f, Expression of screen hits summarized by cell cluster based on a single-cell RNA sequencing atlas of developing human cortex30.

