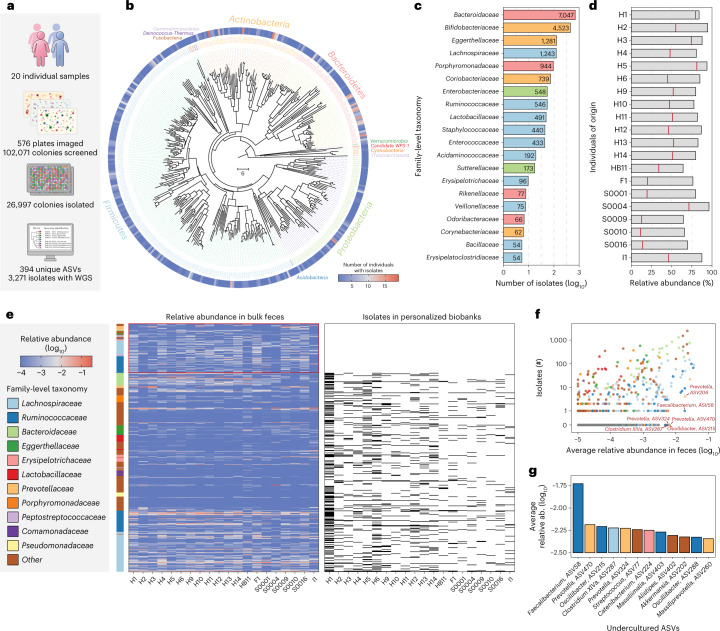
Fig. 2. Generation of personalized gut isolate biobanks for 20 individuals.
a, Statistics of 20 personalized gut isolate biobanks. b, Phylogenetic tree of 394 ASVs covered by 26,997 gut microbiome isolates in this study. Neighbor-joining tree of phylogeny was constructed based on 16S V4 sequences. Branch color distinguishes bacterial phylum, and the outer circle shows the prevalence of isolated ASVs in the 20 biobanks. c, Number of isolates for top 20 family-level taxonomy. d, Accumulated relative abundance of the ASVs represented by isolates from personalized biobanks in original fecal samples. The bars show isolates from any individual in the entire collection and the red lines show isolates derived from the same person. e, Heatmaps for relative abundance of abundant ASVs in original fecal samples and presence or absence in the biobanks. ASVs with average relative abundance > 0.1% are shown and the side bar on the left represents their family-level taxonomy. ASVs found in personalized biobanks are shown as black bars in the right heatmap and uncultured ASVs not found in any biobank are highlighted. f, Correlation of average relative abundance in original feces sample and number of isolates in entire collection for ASVs. Highly abundant ASVs that are difficult to culture, that is, with fewer isolates, are highlighted. g, Average relative abundance of top abundant ASVs but with no more than 2 isolates in the entire collection. Color of bars represents family-level taxonomy.

