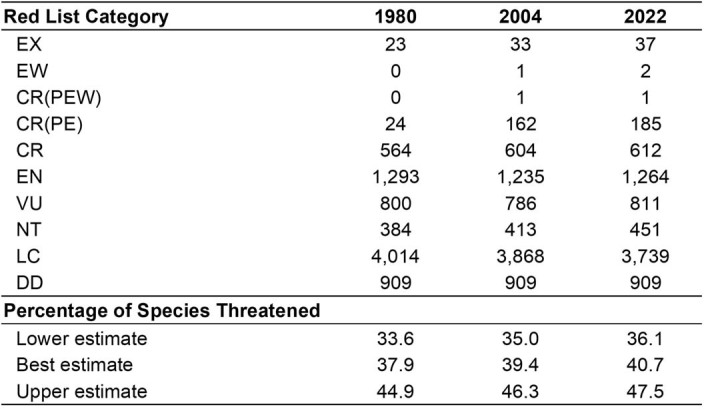
Extended Data Table 1.
Number of species in each Red List category for 1980, 2004, and 2022

The 1980 and 2004 categories were determined by applying the backcasting methods outlined in Butchart et al.5. The 2022 Red List categories are the results of the GAA2 study and the most recent assessment for each species. The Critically Endangered (CR) category has an additional option to tag a species as “Possibly Extinct (PE)” or “Possibly Extinct in the Wild (PEW)”. The disaggregation of CR species has been provided in this table to emphasize the large number of amphibians that are categorised as CR(PE). Following the methods outlined in Section 4.1, the best, lower, and upper estimate of the percentage of threatened or extinct species is calculated for each point in time. There has been a steady increase in the percentage of threatened amphibians from 37.9% (1980) to 39.4% (2004) to 40.7% (2022). It should be noted that the two time periods (1980–2004 and 2004–2022) are not equal; the first one being 24 years and the second only 18. From 1980 to 2004, an additional 118 species were categorised as threatened. An additional 90 species are threatened as of 2022. From 1980 to 2004, the total number of species listed as VU and EN decreased, while the number listed as CR considerably increased from 588 to 766. In 1980, 24 species were considered CR(PE), but by 2004 the number of CR(PE) species rose to 162. The number of species declared EX also increased from 23 in 1980, to 33 in 2004. In contrast, from 2004 to 2022, the number of species in each of the threatened categories increased by a similar amount; the number of CR(PE) species increased by 23; and the number of EX species increased by four, which is substantially less than the previous time period, but still of significant conservation concern.
