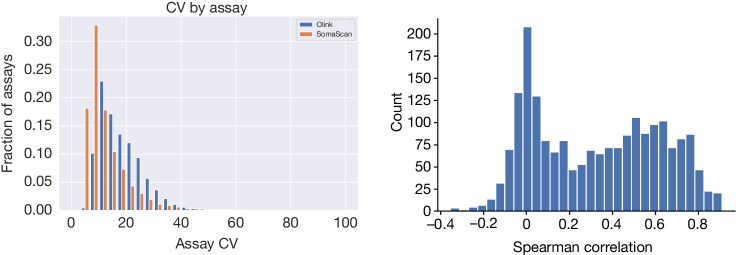
Fig. 1. Protein levels measured by individual assays.
Left, repeatability of measurements by platform. The CV for repeated measurements with each assay was used to evaluate the precision of the assay. The median CV for the Olink Explore 3072 assays (blue) was higher than the median CV for the SomaScan v4 assays (orange) (16.5% and 9.9%, respectively, Mann-Whitney P < 10–300). The Olink Explore assays were evaluated on 1,474 duplicate measurements from the UKB 47K dataset, whereas the SomaScan v4 assays were evaluated on 227 duplicate measurements from the Iceland 36K dataset. Right, correlation between measurements for protein levels measured using assays on the Olink Explore 3072 and SomaScan v4 platforms in the Iceland 1K dataset (Spearman correlation), evaluated by measuring plasma samples from 1,514 individuals using both platforms.

