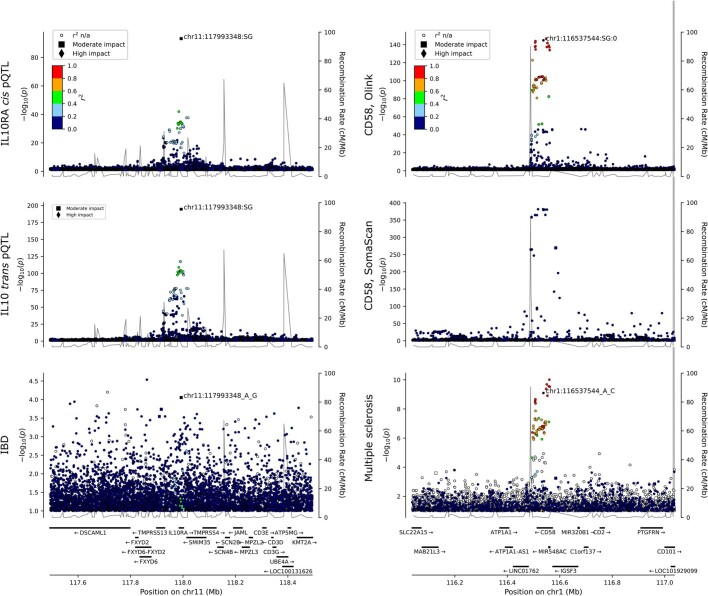
Extended Data Fig. 8. Association with protein levels and disease risk.
Left: Association at IL10RA locus between variants and protein levels of IL10RA and IL10 measured using Olink Explore and IBD risk. All r2 are shown to the same variant. Right: Association at CD58 locus between variants and CD58 levels measured using Olink Explore, CD58 levels measured using SomaScan v4 and multiple sclerosis risk. All r2 are shown to the same variant. p-values were based on a two-sided likelihood ratio test and not adjusted for multiple comparisons.

