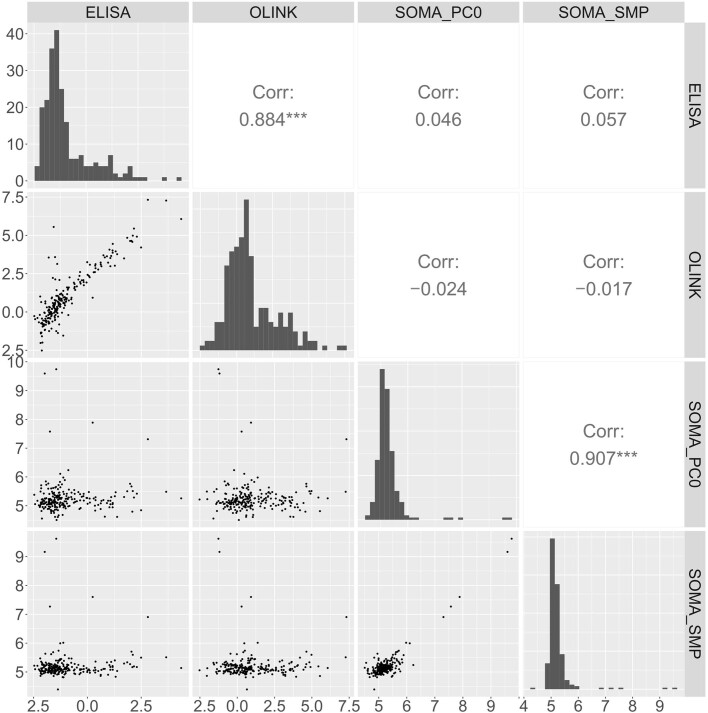
Extended Data Fig. 9. Comparison of IL10 measurements.
Protein levels of IL10 as measured by ELISA compared with measurements from Olink Explore 3072, SomaScan v4 non-normalized (SOMA_PC0) and normalized (SOMA_SMP). ‘***’ represents p < 0.001, based on a two-sided t-test, not corrected for multiple comparisons. The exact p-values were 1.5 × 10-75 for the correlation between OLINK and ELISA data and 1.1×10-85 for the correlation between SOMA_PC0 and SOMA_SMP data.

