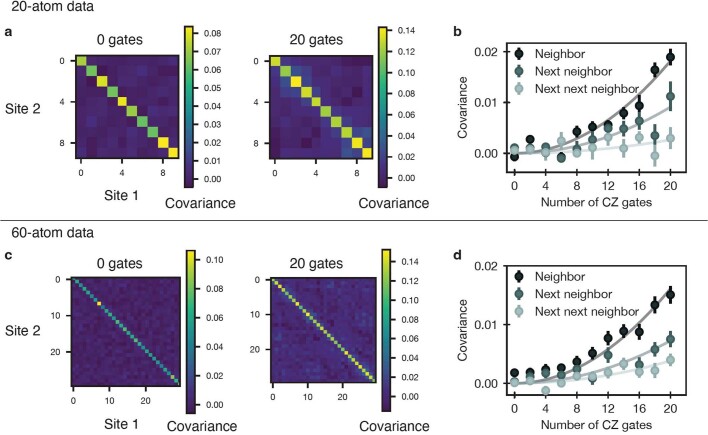
Extended Data Fig. 8. Correlations between gate sites.
a, Covariance matrices for the 20-atom data in Fig. 3b after 0 gates and 20 gates, in which local correlations appear after 20 gates. b, Covariance averaged over all neighbours, next nearest neighbours and next next nearest neighbours, as a function of the number of CZ gates applied. As a guide to the eye, data are fit to quadratic curves. c, Covariance matrices for 60-atom data in Fig. 3d for 0 gates and 20 gates. d, Plotting covariance for neighbouring sites for the 60-atom data. Once again, the covariance between nearby sites exhibits small growth throughout the 20 CZ gates applied, in particular for the nearest-neighbour sites.

