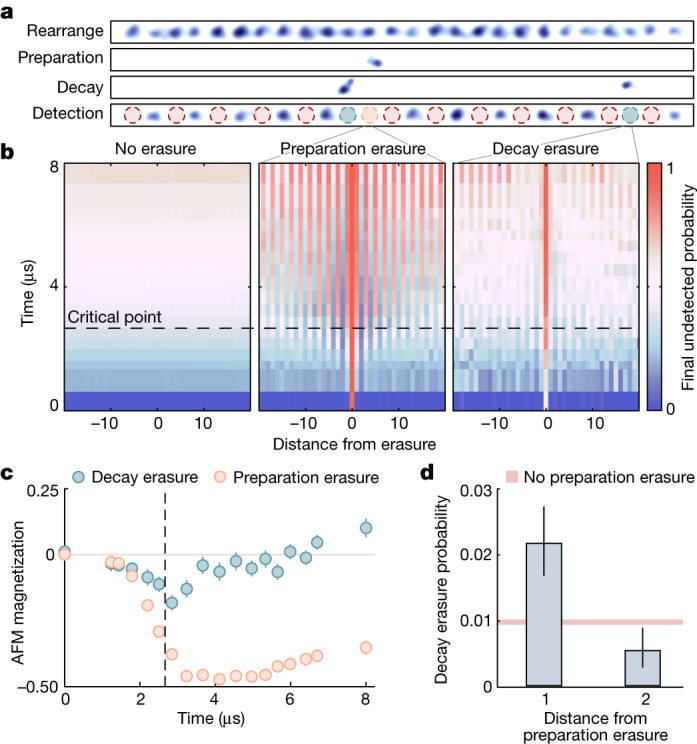
Fig. 4. Learning from erasure errors.

a, Post-processed30 single-shot atom fluorescence images (Methods). After arranging the array (top panel), we use the fast erasure images to learn how detected errors (middle panels) affect detection outcomes (bottom panel). b, Conditional probability to detect no atom in the final image as a function of sweep progress and distance from a hypothetical erasure event. In the case of no erasures (left), the resulting profile is uniform. However, when conditioning on detecting a preparation erasure (middle), the error breaks the symmetry by establishing a single AFM order. In the case of conditioning on decay errors (right), the situation is more complex. c, AFM magnetization (equation (1)) as a function of time. Preparation erasures (orange markers) lead to a growth of a single AFM order with Rydberg excitations predominantly on sublattice A (defined as sites an odd distance from the erasure position). Decay erasures (green markers) follow a similar trend at early times by acting as effective preparation errors, but past the critical point (vertical dashed line), their behaviour reverses: a decay erasure spontaneously breaks the two-fold symmetry, where the neighbouring sites must have been in the ground state due to the structure, yielding Rydberg excitations on sublattice B. d, For the maximum sweep duration, the probability of detecting a Rydberg decay erasure (bars) is significantly increased (decreased) from the baseline level (pink fill) at a distance of one (two) away from the site of a detected preparation erasure, induced by the altered Rydberg population on these sites due to the crystal formation in b, indicating direct detection of correlations between errors through erasure imaging. Error bars represent the standard error of the mean.
