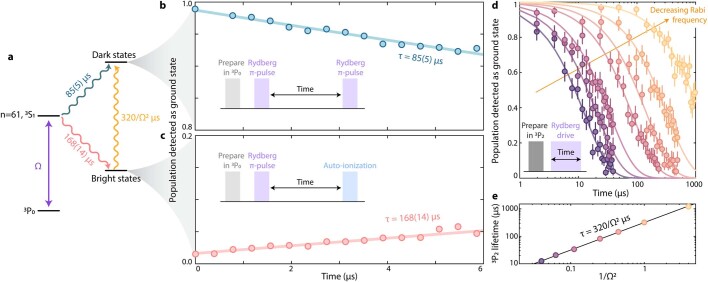
Extended Data Fig. 2. Rydberg lifetime.
a, Pseudo-level diagram of the Rydberg dynamics and associated decay channels. During Rydberg evolution with Rabi frequency Ω, the Rydberg atom can decay either into a set of states which is ‘bright’ to the imaging process (including both the erasure images and the final detection images), e.g states like 5s5p 3P2, or into states which are ‘dark’ to the imaging process, e.g. nearby Rydberg states. A small percentage of decays into ‘bright’ states can go directly into 3P0 where they can be re-excited by the Rydberg driving; note that such decays are dark in the erasure image, but bright in the final detection image. b, Measurement of the dark state decay lifetime, measured by performing a π-pulse on the Rydberg transition, waiting a variable amount of time, and then returning atoms to the ground state (inset). c, Measurement of the bright state decay lifetime, measured by performing a Rydberg π-pulse, waiting, and then performing an auto-ionization pulse to destroy any remaining Rydberg or dark state excitations. d, We prepare atoms into 3P2 (a bright state), and then perform continuous Rydberg driving. Atoms are lost from the trap at a rate which increases with increasing Rabi frequency. e, The lifetime of atoms in 3P2 scales inversely with the square of the Rabi frequency (i.e. scales inversely with the intensity of the Rydberg beam). We attribute this to a photo-ionization process which can convert bright state decay into dark state decay through prolonged Rydberg excitation, as shown in a. Markers in b-d are experimental data where error bars are often smaller than the marker sizes, and solid lines represent exponential fits.

