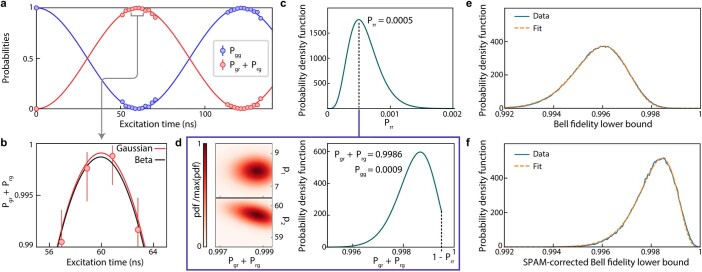
Extended Data Fig. 5. Bell state fidelity measurement from blockaded Rabi oscillations.
a, Probabilities of measuring both atoms in the ground state Pgg (blue markers) and a single atom in the ground state Pgr + Prg (red markers) in the blockaded regime as a function of excitation time. Solid lines are guides to the eye. b, Zoom over the π time, where we prepare the Bell state (see main text). We use a quadratic fit function of the form to extract the population values at π and 2π times. We show the fit results (i) assuming the experimental data have a Gaussian uncertainty (red line), and (ii) using their true Beta distribution (black line). c,d, Fitting method used to obtain the probability distributions of Prr, Pgg, and Pgr + Prg at π and 2π times. We first experimentally obtain the Beta distribution of the probability Prr to observe both atoms in the Rydberg state. We then perform a joint fit on Pgr + Prg and Pgg with the same p1 and p2 fit coefficients for both. We fix the value of Prr, and condition the joint fit such that the sum of all probabilities is always equals to one. We repeat this process for various values of Prr. The results shown here are for Prr = 0.0005, which is the mode of the obtained Beta distribution for Prr. The fitting method uses the true, experimentally measured Beta distribution of each data point. We obtain corresponding probability density functions for each Prr. We perform this method independently for both π and 2π times. e, Resulting Bell state fidelity lower bound using the probability density functions of Prr and Pgr + Prg. We start by randomly drawing from the Prr distribution, then assign the corresponding probability density function of Pgr + Prg, and draw a value from it. The asymmetry between Pgr and Prg is obtained by averaging over each experimental data point, and is assumed to be Gaussian. We repeat this process 1 million times for both π and 2π times. We obtain the corresponding probability density function (blue line), which we fit using a Beta distribution (orange dashed line). f, SPAM-corrected Bell state fidelity lower bound distribution, obtained by correcting the probabilities after randomly drawing them from their respective probability density functions.

