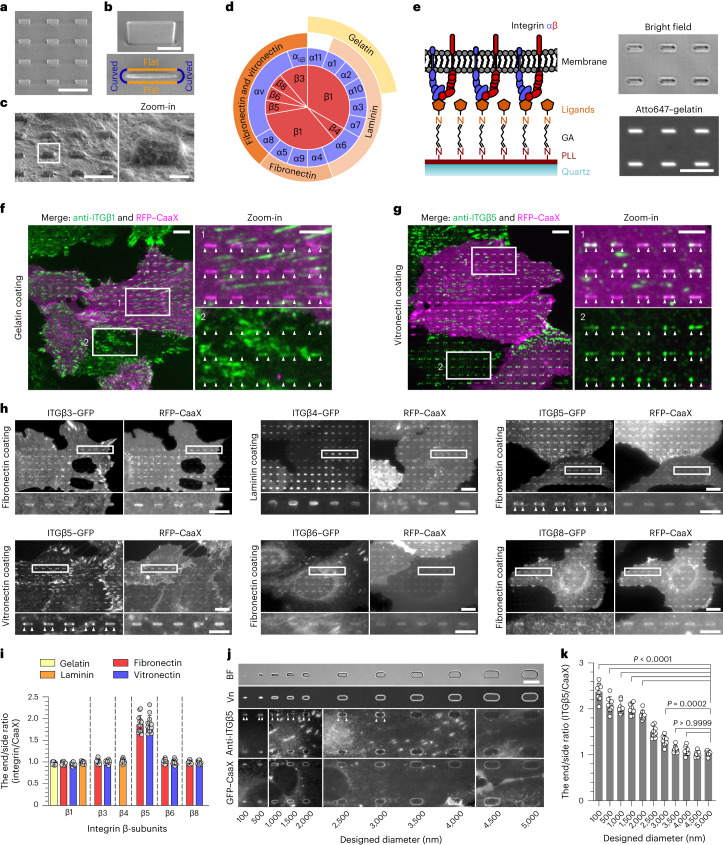
Fig. 1. Positive membrane curvature induces selective accumulation of integrin β5.
a, SEM image of nanobars viewed at a 45° angle. Scale bar, 5 µm. b, Single nanobar viewed at a 45° angle (top) and from the top (bottom). Scale bar, 1 µm. c, SEM image showing cell membrane deformation on nanobars. Scale bar, 5 µm (full size) or 1 µm (inset). d, Chart showing the integrin β-subunits probed in this study, with their respective ɑ-subunits and ECM ligands. e, Left: schematic of an ECM ligand-coated surface. Right: bright-field and fluorescence images of nanobars coated with Atto647–gelatin. Scale bar, 5 µm. GA, glutaraldehyde. f, Anti-ITGβ1 on gelatin-coated nanobar substrate does not show accumulation at nanobars visualized by a membrane marker RFP–CaaX transiently expressed in some cells. Scale bar, 10 µm (full size) or 5 µm (insets). Arrowheads indicate nanobar ends. g, Anti-ITGβ5 on vitronectin-coated nanobar substrate shows preferential accumulation at the nanobar ends (arrowheads), whereas RFP–CaaX is relatively evenly distributed along the same nanobars. Scale bar, 10 µm (full size) or 5 µm (insets). h, Fluorescence images of GFP-tagged β3, β4, β5, β6 and β8 integrins co-expressed with RFP–CaaX on nanobar substrates with their respective ECM protein coatings. Only ITGβ5–GFP shows preferential accumulation at nanobar ends (arrowheads). Scale bar, 10 µm (full size) or 5 µm (insets). More images are included in Extended Data Fig. 2a. i, Quantifications of curvature preferences of integrin β-subunits by measuring their nanobar end/side ratios, normalized by the end/side ratios of RFP–CaaX at the same nanobars. Each data point represents the mean value from a single cell having between 26 and 158 nanobars (see source data for Fig. 1). n = 12 cells, pooled from 2 independent experiments per condition. j, Probing the curvature range that induces ITGβ5 accumulation using gradient nanobar arrays. First row: bright-field (BF) image of gradient nanobars. Second row: fluorescence image of gradient nanobars coated with Cy3–vitronectin (Vn). Third and fourth rows: anti-ITGβ5 in cells expressing GFP–CaaX on vitronectin-coated gradient nanobars. Arrowheads indicate nanobar ends. Scale bar, 10 µm. k, Quantification of the end/side ratio of ITGβ5/CaaX on gradient nanobars. n = 8 images for each condition, from 2 independent experiments. P values calculated using one-way ANOVA with Bonferroni’s multiple comparison. Data are the mean ± s.d. Source numerical data are available in the source data.

