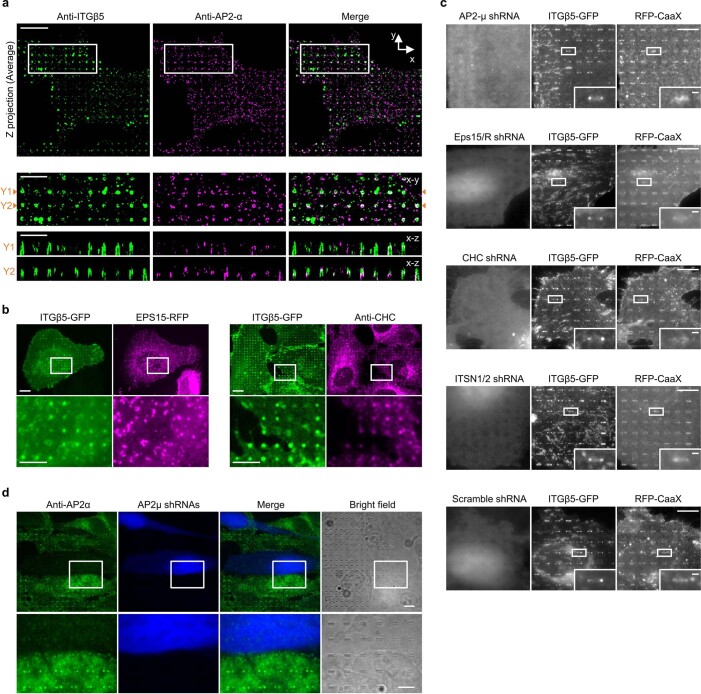
Extended Data Fig. 6. Curved adhesions are different from clathrin lattices.
a, Expansion microscopy showing that ITGβ5 and AP2 are not spatially correlated at the nanopillar-membrane interface. Expansion microscopy is used to increase the spatial resolution of optical imaging for the nanopillar-membrane interface (see the method section and Ref. 33 for detailed descriptions). Both ITGβ5 and AP2-α are immunolabelled. Top: x-y images of the z projection (average). Bottom: zoom-in x-y images of the area indicated by the white boxes. x-z images showing the distribution of immunolabelled ITGβ5 and AP2-α along nanopillars at y = Y1 and y = Y2 in the zoom-in images. Even when ITGβ5 and AP2-α accumulate on the same nanopillar in the x-y image, they are not correlated in the z-dimension. Scale: full-size, 10 µm; insets, 5 µm. b, Right: Both ITGβ5-GFP and immunolabelled clathrin heavy chain (CHC) accumulate at vitronectin-coated nanopillars, but their intensities are not correlated. Nanopillars with high intensities of ITGβ5-GFP are usually not the nanopillars with high intensities of anti-CHC. Left: ITGβ5-GFP accumulates at vitronectin-coated nanopillars, but the co-transfected EPS15-RFP does not show strong accumulation or correlation with ITGβ5-GFP at these nanopillars. Scale: full-size, 10 µm; insets, 5 µm. c, Representative fluorescence images showing that the shRNA knockdown of AP2-μ, clathrin heavy chain (CHC), EPS15/R, or ITSN1/2 does not affect the accumulation of ITGβ5-GFP accumulation at the ends of vitronectin-coated nanobars in U2OS cells expressing RFP-CaaX membrane marker. BFP expression is a marker of shRNA transfection. Quantifications of the β5-GFP curvature preference under these conditions are presented in Fig. 3d. Scale: full-size, 10 µm; insets, 1 µm. d, Validation of AP2 knockdown by immunofluorescence. Immunofluorescence showing that the transfection of AP2-μ shRNAs (indicated by BFP expression) can reduce the appearance of AP2 complexes and the accumulation of AP2 complex at the ends of vitronectin-coated nanobars in U2OS cells. Scale: full-size, 10 µm; insets, 5 µm.

