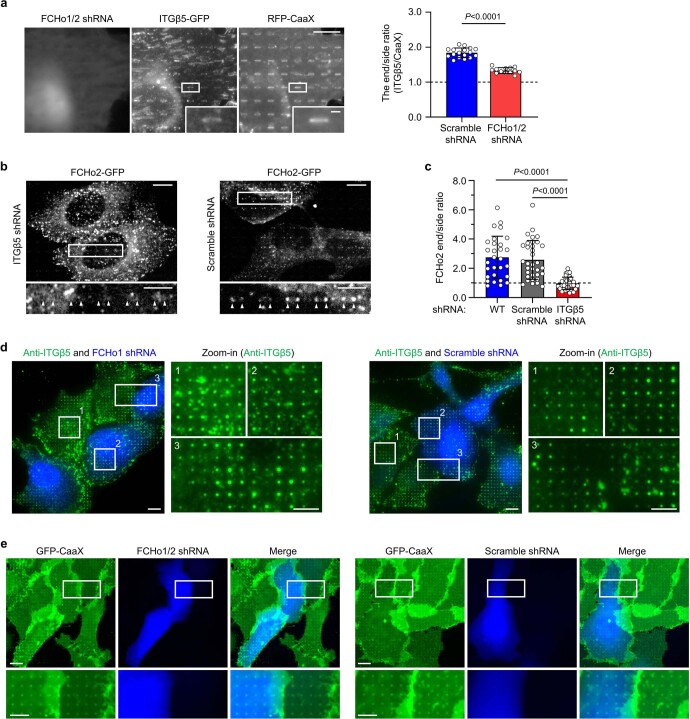
Extended Data Fig. 7. FCHo2, but not FCHo1, is correlated with ITGβ5 in curved adhesions.
a, Left: Representative fluorescence images showing that knockdown of FCHo1/2 reduces the β5-GFP accumulation at vitronectin-coated nanobar ends. Scale: full-size, 10 µm; insets, 1 µm. Right: Quantifications of the β5-GFP curvature preference in U2OS cells transfected with scramble or FCHo1/2 shRNAs. n = 17/13 cells, from two independent experiments. Data are presented as the mean ± s.d. P values calculated using two-tailed t-test. b, Representative fluorescence images showing that compared with scramble shRNA transfection (right), shRNA knockdown of ITGβ5 (left) reduces the FCHo2-GFP accumulation at the ends of vitronectin-coated nanobars in U2OS cells. Scale: full-size, 10 µm; insets, 5 µm. c, Quantifications of the FCHo2-GFP curvature preference in wild-type, scramble shRNA-transfected, or ITGβ5-knockdown U2OS cells. n = 29/34/36 cells, from two independent experiments. Data are presented as the mean ± s.d. P values calculated using one-way ANOVA with Tukey’s multiple comparison. d, Representative fluorescence images showing that neither shRNA knockdown of FCHo1 (left) nor scramble shRNA transfection (right) affects ITGβ5 accumulation at vitronectin-coated nanopillars. Scale: full-size, 10 µm; insets, 5 µm. e, Representative fluorescence images showing that compared with scramble shRNA transfection (right), shRNA knockdown of FCHo1/2 (left) does not affect membrane wrapping around vitronectin-coated nanopillars in U2OS cells expressing GFP-CaaX membrane marker. BFP expression is a marker of shRNA transfection. Scale: full-size, 10 µm; insets, 5 µm. Source numerical data are available in source data.

