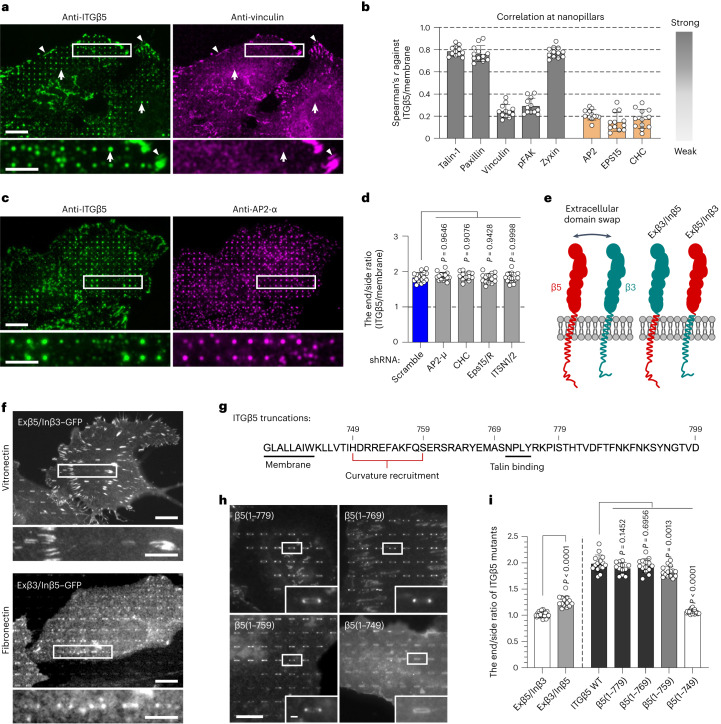
Fig. 3. Curved adhesions involve a subset of adhesion proteins and require the juxtamembrane region of ITGβ5 cytoplasmic tail.
a, Vinculin colocalizes with ITGβ5 in focal adhesions (arrowheads) on flat areas but is absent from curved adhesions (arrows) at nanopillars. Scale bar, 10 µm (full size) or 5 µm (insets). b, Spearman’s correlation coefficients between ITGβ5 and focal adhesion proteins (grey bars) or between ITGβ5 and clathrin-mediated endocytic proteins (orange bars) at nanopillars. Each cell covers between 102 and 769 nanopillars (see source data for Fig. 3). n = 12 cells, pooled from 2 independent experiments per condition. c, Both ITGβ5 and AP2-ɑ preferentially localize at nanopillars but their intensities are not correlated. Zoom-in images show that nanopillars with high AP2 intensities often have lower ITGβ5 intensities. Scale bar, 10 µm (full size) or 5 µm (insets). d, Quantification of ITGβ5 accumulation in curved adhesions (end/side ratio at nanobars) following shRNA knockdown of different endocytic proteins. Left to right, n = 17, 15, 12, 14 and 15 cells, from 2 independent experiments. e, Illustration of the construction of chimeric Exβ5/Inβ3 and Exβ3/Inβ5 proteins. f, Exβ5/Inβ3 forms prominent focal adhesions but does not accumulate at the ends of nanobars, whereas Exβ3/Inβ5 shows curvature preference for nanobar ends. Scale bar, 10 µm (full size) or 5 µm (insets). g, Sequence of the ITGβ5 cytoplasmic domain and the truncation sites. h, Fluorescence images of GFP-tagged ITGβ5 truncations β5(1–779), β5(1–769), β5(1–759) and β5(1–749) on vitronectin-coated nanobars. All truncations, except β5(1–749), show curvature preference for nanobar ends. Scale bar, 10 µm (full size) or 1 µm (insets). i, Quantification of the curvature preferences of chimeric, wild-type (WT) and truncated ITGβ5 by measuring their nanobar end/side ratio. Left to right, n = 19, 14, 15, 12, 14, 15 and 18 cells, from 2 independent experiments. Data are the mean ± s.d. P values calculated using one-way ANOVA with Bonferroni’s multiple-comparison (d,i, WT versus truncations) or two-tailed t-test (i, Exβ5/Inβ3 versus Exβ3/Inβ5). Source numerical data are available in the source data.

