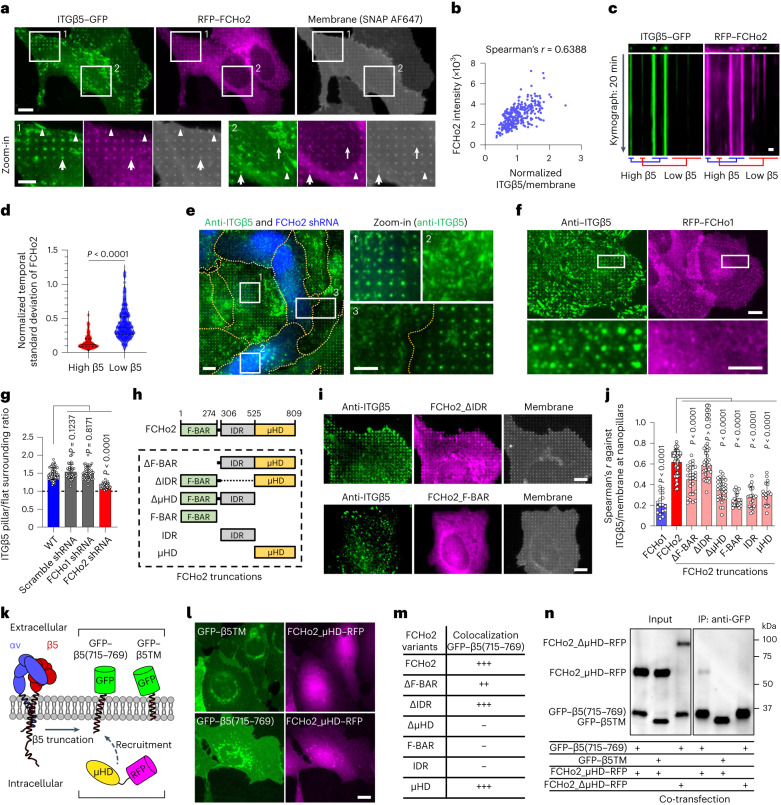
Fig. 4. Curved adhesions require a curvature-sensing protein, FCHo2.
a, RFP–FCHo2 positively correlates with ITGβ5–GFP in curved adhesions (arrows) at vitronectin-coated nanopillars. In the same image, FCHo2 is absent in focal adhesions (arrowheads) and clathrin-containing adhesions (thin arrows). Scale bar, 10 µm (full size) or 5 µm (insets). b, Scatter plot of RFP–FCHo2 intensity against the ITGβ5/membrane ratio at n = 353 nanopillars from the cell shown in a. See g for the correlation between ITGβ5 and FCHo2 at nanopillars, analysed in multiple cells. c, Kymographs of ITGβ5–GFP and RFP–FCHo2 at vitronectin-coated nanopillars imaged at 15 s per frame for 20 min. Scale bar, 1 µm. d, The temporal standard deviations of RFP–FCHo2 for 20 min at n = 104 high β5 and 313 low β5 nanopillars, from 2 independent cells. For each cell, nanopillars were divided into two groups based on ITGβ5 intensities: high-β5 nanopillars (top 25%) and low-β5 nanopillars (bottom 75%). Standard deviation values are normalized to the initial intensities. Medians (lines) and quartiles (dotted lines) are shown. e, FCHo2 knockdown significantly reduces nanopillar-induced ITGβ5 accumulation. BFP expression is a marker of shRNA transfection. Scale bar, 10 µm (full size) or 5 µm (insets). f, ITGβ5 does not colocalize with FCHo1 at nanopillars. Scale bar, 10 µm (full size) or 5 µm (insets). g, Quantification showing that FCHo2 knockdown significantly reduces nanopillar-induced ITGβ5 accumulation, but FCHo1 knockdown cannot. Left to right, n = 68, 43, 44 and 30 cells, from 2 independent experiments. h, Illustration of FCHo2 domain organization and truncations. i, Representative images showing that FCHo2_ΔIDR correlates with ITGβ5 in curved adhesions at nanopillars, but FCHo2_F-BAR does not. FCHo2_F-BAR overexpression also reduces ITGβ5 accumulation at nanopillars. Scale bar, 10 µm. j, Spearman’s correlation coefficients of FCHo1, FCHo2 and truncated FCHo2 with ITGβ5 at vitronectin-coated nanopillars. Left to right, n = 17, 48, 29, 29, 31, 22, 20 and 17 cells, from 2 independent experiments. k, Illustration of the engineered proteins GFP–β5(715–769) and GFP–β5TM, and the cytosolic protein FCHo2_µHD–RFP. l, Top: FCHo2_µHD-RFP is cytosolic and diffusive when co-expressed with GFP–β5TM. Bottom: when co-expressed with GFP–β5(715–769), FCHo2_µHD–RFP colocalizes with GFP–β5(715–769) in the perinuclear Golgi region. Scale bar, 10 µm. m, Qualitative analysis of GFP–β5(715–769)-induced membrane re-localization of FCHo2 variants. n, Immunoblots of co-immunoprecipitation assay confirms the interaction between the ITGβ5 juxtamembrane region and FCHo2_µHD. Data are the mean ± s.d. (g,j). P values calculated using Mann–Whitney test (d) or one-way ANOVA with Bonferroni’s multiple comparison (g,j). Source numerical data and unprocessed blots are available in the source data.

