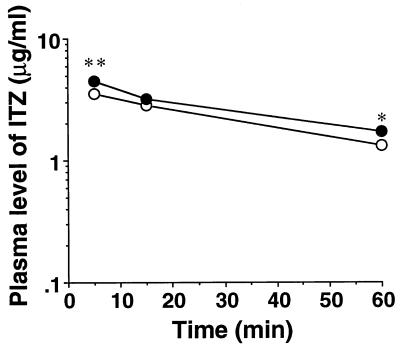
FIG. 7.
Plasma ITZ concentration-time profiles after intravenous administration of the drug at a dose of 5 mg/kg to mdr1a knockout mice. The plasma ITZ concentration was determined by HPLC as described in Materials and Methods. Each point represents the mean ± SE (n = 3 to 4). Values determined to be significantly different from those of mdr1a +/+ mice by Student’s t test are indicated (∗, P < 0.05; ∗∗, P < 0.001). Symbols: •, mdr1a −/− mice; ○, mdr1a +/+ mice.

