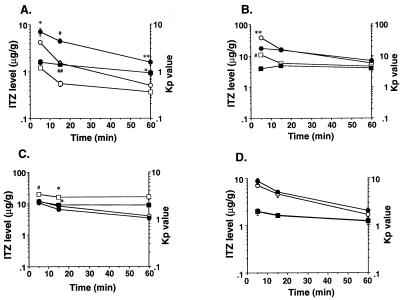
FIG. 8.
Distribution of ITZ in mdr1a knockout mouse organs after intravenous administration of this drug at a dose of 5 mg/kg. Shown are ITZ concentrations and Kp values for brain (A), liver (B), kidney (C), and lung (D) tissues. Each Kp value was calculated by dividing the organ ITZ concentration by the plasma ITZ concentration. Each point represents the mean ± SE (n = 3 to 4). Values found to be significantly different from control values by Student’s t test are indicated (∗, P < 0.05; ∗∗, P < 0.01; #, P < 0.005; ##, P < 0.001). Symbols: •, concentration, mdr1a −/− mice; ○, concentration, mdr1a +/+ mice; □, Kp value, mdr1a −/− mice; ▪, Kp value, mdr1a +/+ mice.

