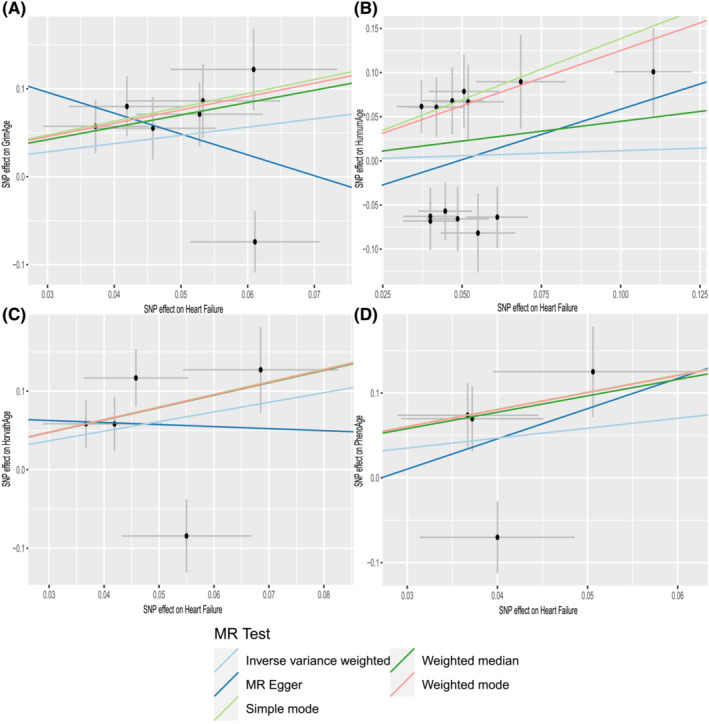
Figure 4.

Scatter plots of HF and epigenetic age. Horizontal ordinate: single–nucleotide polymorphisms (SNPs) effect on ‘exposure’; vertical coordinates: SNP effect on ‘outcome’. (A) Exposure: HF; outcome: GrimAge. (B) Exposure: HF; outcome: HannumAge. (C) Exposure: HF; outcome: HorvathAge. (D) Exposure: HF; outcome: PhenoAge. MR, Mendelian randomization.
