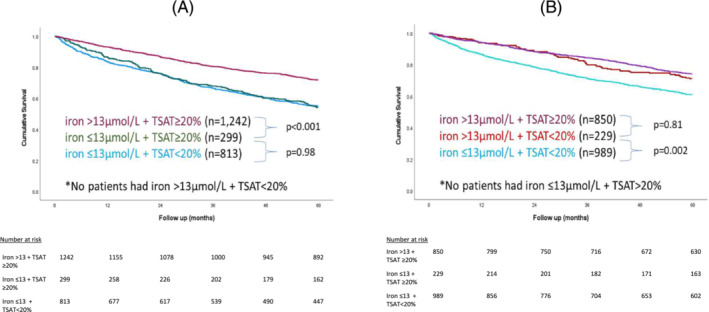
Figure 5.

Kaplan–Meier survival curves for all‐cause mortality for patients within quartiles 1 and 2 (A) and quartiles 3 and 4 (B) according to serum iron concentrations (≤13 μmol/L or >13 μmol/L) and TSAT (<20% or ≥20%). Log‐rank P‐values provided. Serum iron >13 μmol/L and TSAT ≥20% used as reference in each. P‐values between groups also provided. No patient had SIC >13 μmol/L + TSAT <20%.
