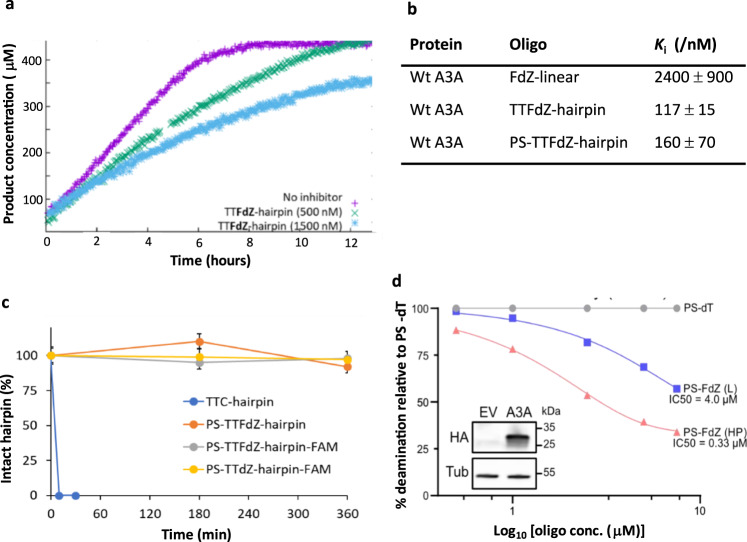
Fig. 4. TTFdZ-hairpin and its nuclease-resistant phosphorothioated derivative are potent inhibitors of A3A compared to linear ssDNA with FdZ.
a Plot of product concentration versus time in the absence and presence of TTFdZ-hairpin at 500 and 1500 nM; concentration of A3A 140 nM; concentration of TTC-hairpin substrate 500 μM. b Table shows derived inhibition constants, Ki for linear FdZ ssDNA (A2T2FdZA4), TTFdZ-hairpin and its phosphorothioated analog PS-TTFdZ-hairpin. The kinetic parameters were derived from the integrated Michaelis-Menten equation by means of Lambert’s W function58, which provides more robust estimates for kinetic parameters Km and Vmax than analysis of initial rates only. c Percentage of intact hairpins (15 μM) over time upon treatment with snake venom phosphodiesterase (phosphodiesterase I, Sigma, 32 mU/mL) in 50 mM Tris-HCl buffer, 10 mM MgCl2, pH 8.0 for the indicated times at 37 °C. Data are presented as mean values of two independent experiments on each sample; errors bars are estimated instrumental error of ± 5%. Full experimental details are available in Supplementary Information. d Concentration-dependent inhibition of A3A in cell lysates by phosphorothioated TTFdZ-hairpin. Bands from SDS-PAGE (Supplementary Fig. S10b) were quantified, normalized to the PS-TTT-hairpin (denoted PS-dT oligo) and used to determine the IC50 for linear PS-TTFdZ (denoted PS-FdZ (L)) and PS-TTFdZ-hairpin (denoted PS-FdZ (HP)). This experiment was repeated once more (n = 2 biologically independent replicates), and data are from one representative gel. The inset panel is an immunoblot showing expression of A3A-HA from cell lysate. A3A-HA was detected by an anti-HA antibody while anti-tubulin was used as a loading control. EV denotes the empty vector control. Raw immunoblot images are located in Supplementary Fig. 10a.

