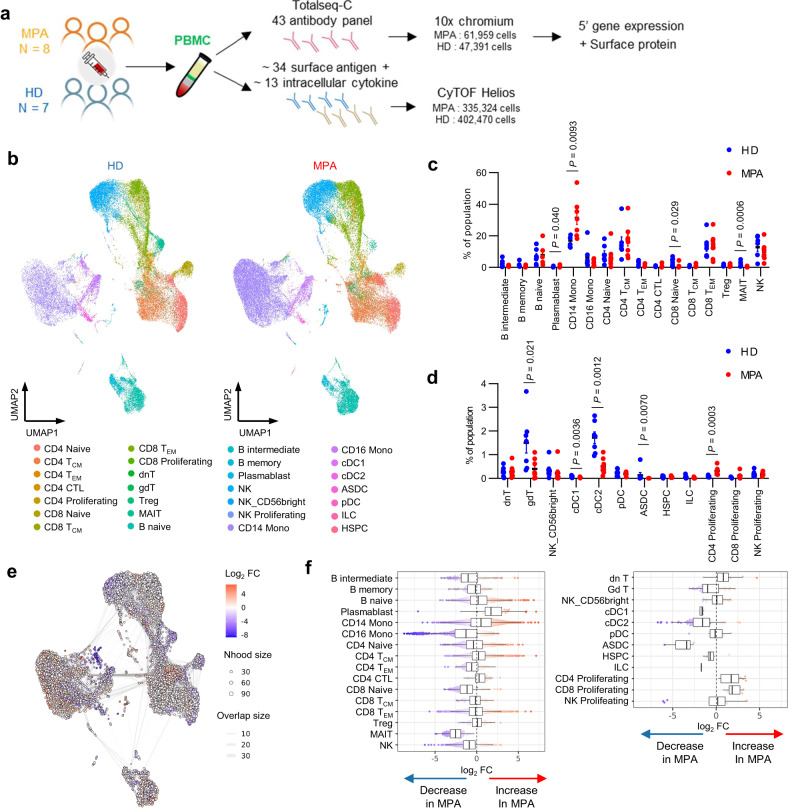
Fig. 1. CITE-seq analysis of PBMCs from healthy donors and patients with newly diagnosed, treatment-naïve MPA.
a Overview of the experimental workflow. MPA microscopic polyangiitis, HD healthy donors, PBMC peripheral blood mononuclear cells. b UMAP plots showing CITE-seq data of 47,391 PBMCs derived from healthy donors (n = 7, left) and 61,959 PBMCs derived from patients with MPA (n = 8, right). 28 cellular clusters were annotated with reference mapping. TCM central memory T cells, TEM effector memory T cells, CTL cytotoxic T lymphocytes, dnT double negative T cells, gdT gamma-delta T cells, Treg regulatory T cells, MAIT mucosal associated invariant T cells, NK natural killer cells, Mono monocytes, cDC classical dendritic cells, ASDC AXL+ dendric cells, pDC plasmacytoid dendritic cells, ILC innate lymphoid cells, HSPC hematopoietic stem and progenitor cells. Percentage of each cellular subpopulation relative to total number of PBMCs derived from healthy donors (n = 7, blue dots) and patients with MPA (n = 8, red dots) for the clusters with an average ratio of 1% or greater (c) and less than 1% (d). Values are means with SEMs and nominal P-values are calculated using a two-sided Mann-Whitney U test. e Neighborhood graph of monocytes using Milo differential abundance testing. Nodes represent neighborhoods from the PBMC population. Colors indicate the log2-fold difference between patients with MPA and healthy donors. Neighborhoods that increased in patients with MPA are shown in red. Neighborhoods decreased in patients with MPA are shown in blue. f Beeswarm and box plots showing the distribution of log2-fold differences in neighborhoods in different cell type clusters. Colors are represented similarly to e. Box plots show median and interquartile range (IQR); the lower and upper hinges correspond to the first and third quartiles. The upper whisker extends from the hinge to the largest value no further than 1.5*IQR from the hinge. The lower whisker extends from the hinge to the smallest value at most 1.5*IQR from the hinge. Source data are provided as a Source Data file.

