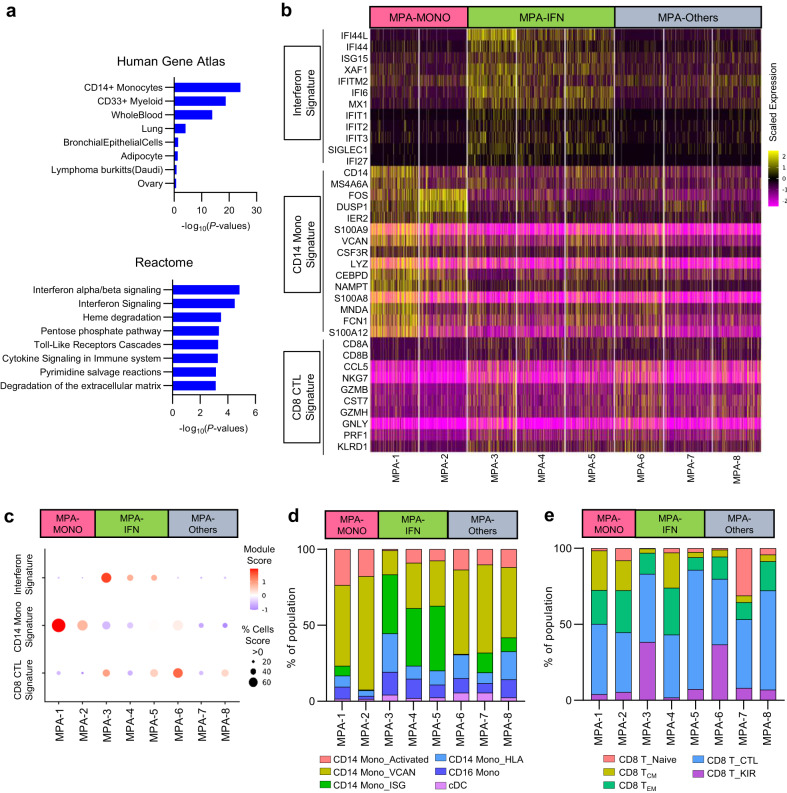
Fig. 3. Identification of transcriptome-based phenotypes of MPA.
a Gene set enrichment analysis of differentially expressed genes from patients with MPA using Gene Atlas from BioGPS (upper) and Reactome 2015 (bottom). P-values for each pathway were calculated by Benjamini–Hochberg method. b Heatmap showing the scaled expression of interferon signature genes, CD14+ monocyte signature genes, and CD8+ cytotoxic T lymphocyte (CTL) signature genes in PBMCs at the single-cell level. Each column indicates a patient with MPA (n = 8). c Balloon plots showing the averaged expression level of the signature genes shown in b. Each module score was calculated based on the scaled average expression level in PBMCs and the percentage of cells was calculated as the proportion of cells with a module score > 0. d Bar plots showing the proportion of each monocyte subpopulation relative to total the number of monocytes. Each subpopulation was annotated in a similar fashion as in Fig. 2a. e Bar plots showing the proportion of each CD8+ T cell subpopulation relative to the total number of CD8+ T cells. Each subpopulation was annotated in a similar fashion as in Fig. 2e. Source data are provided as a Source Data file.

