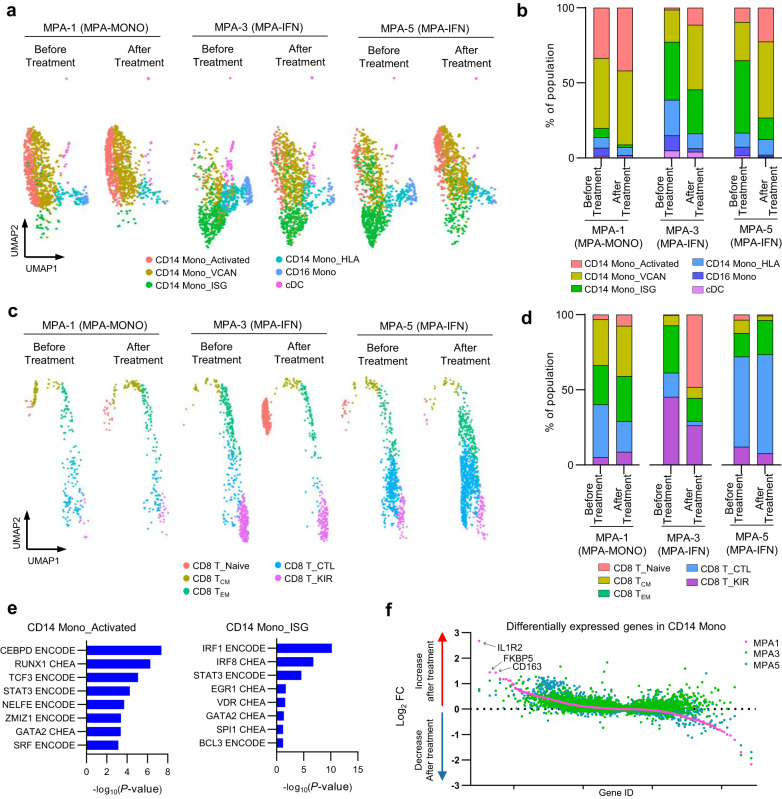
Fig. 4. Changes of transcriptome-based cell populations before and after treatment.
a UMAP plots showing the CITE-seq data of monocyte subpopulations before and after treatment in patients MPA-1, MPA-3, and MPA-5. Each monocyte subpopulation was annotated in a similar fashion as in Fig. 2a. b Bar plots showing the proportion of each monocyte subpopulation relative to the total number of monocytes before and after treatment. c UMAP plots showing the CITE-seq data of CD8+ T cell subpopulations before and after treatment in patients MPA-1, MPA-3, and MPA-5. Each CD8+ T cell subpopulation was annotated in a similar fashion as in Fig. 2e. d Bar plot showing the proportion of each CD8+ T cell subpopulation relative to the total number of CD8+ T cells. e Gene set enrichment analysis of differentially expressed genes in CD14 Mono_Activated (left) and CD14 Mono_ISG (right) using ENCODE and ChEA Consensus TFs from ChIP-X. P-values for each pathway were calculated by Benjamini–Hochberg method. f Scatter plot showing gene expression changes in post-treatment donors compared to pre-treatment donors. Genes are ordered by the fold change values in patient MPA-1. Pink, green, and blue colored dots represent individual genes in patients MPA-1, MPA-3, and MPA-5, respectively. Source data are provided as a Source Data file.

