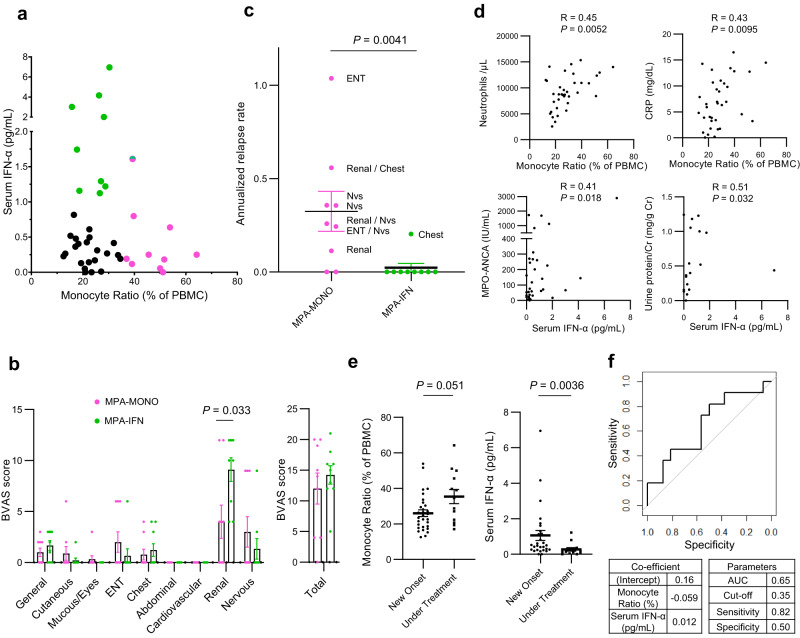
Fig. 5. Translating omics-based classification of MPA to the bedside.
a Serum IFN-α concentrations and the percentage of monocytes among PBMCs in the complete blood count of samples from patients with MPA (n = 43). The 10 samples with the highest percentage of monocytes were classified as MPA-MONO (pink colored dots). The 10 samples with the highest IFN-α concentrations were classified as MPA-IFN (green colored dots). b Characteristic symptoms of patients in the MPA-MONO (n = 9) and MPA-IFN (n = 9) groups. Scores for each component are based on the Birmingham Vasculitis Activity Score (BVAS) 2008 version 3. Mucous; Mucous membranes, ENT; Eyes, nose, and throat. c Annualized relapse rate of patients in the MPA-MONO (n = 9) and MPA-IFN (n = 9) groups. Symptoms at relapse are displayed for each case based on the components of the BVAS. “Nvs” refers to the nervous system. d Correlation between the percentage of monocytes and representative clinical parameters, and between serum IFN-α concentrations and representative clinical parameters. Correlations and P-values were quantified using Kendall’s correlation coefficient (R). CRP C-reactive protein, MPO myeloperoxidase, ANCA anti-neutrophil cytoplasmic antibody. e Differences in serum IFN-α concentrations and monocyte ratio in patients with newly-onset cases (n = 30) and cases under treatment (n = 13). f Receiver Operating Characteristic (ROC) curve for predicting relapse of MPA from serum IFN-α concentration and percentage of monocytes in PBMCs. Values are means with SEMs and P-values are calculated using a two-sided Mann–Whitney U test for b, c, and e. Source data are provided as a Source Data file.

